


Stepping Up Your Support Game with the Right Metrics
Want to deliver outstanding customer support and boost your bottom line? This listicle reveals eight essential customer support metrics you need to track in 2025. Learn how measuring key performance indicators (KPIs) like customer satisfaction score calculation (CSAT) and customer interaction analytics and Net Promoter Score (NPS) provides valuable insights into your customer service effectiveness. By understanding these metrics, you can pinpoint areas for improvement, enhance customer loyalty, and reduce costs. Dive in to discover how optimizing these customer support metrics helps build a thriving business. For a broader guide, check out customer service manager strategies.
Turn Instagram DMs into booked calls
AI that qualifies leads, handles objections, and follows up - so you don't have to.
1. Customer Satisfaction Score (CSAT)
Customer Satisfaction Score (CSAT) is a key customer support metric that measures how satisfied customers are with a specific interaction, product, or service. It's typically used to gauge short-term satisfaction immediately following a support interaction, purchase, or other touchpoint. Customers are generally asked to rate their satisfaction on a numerical scale, most commonly 1-5 or 1-10, with higher scores indicating greater satisfaction. The final CSAT score is then calculated as the percentage of customers who selected the top satisfaction ratings (usually 4 or 5 on a 5-point scale). This provides a clear, quantifiable measure of how well a specific interaction met customer expectations.

CSAT’s simplicity and directness make it a valuable customer support metric for businesses of all sizes. It's easily implemented across various channels like email, chat, WhatsApp CRM integration, and phone, offering immediate feedback on individual interactions. This granular data allows for segmentation by support channel, agent, issue type, and other relevant factors, providing insights into specific areas of strength and weakness within your customer support operations. This makes CSAT a highly effective tool for identifying areas for improvement and optimizing the customer experience.
Features of CSAT:
- Simple to implement and understand
- Provides immediate feedback after interactions
- Can be segmented by support channel, agent, issue type, etc.
- Typically measured on a 1-5 or 1-10 scale
Pros:
- Quick to collect and analyze
- High response rates due to simplicity
- Easily comparable across departments or time periods
- Directly measures customer perception
Cons:
- Subject to response bias (very satisfied and very dissatisfied customers are more likely to respond)
- Measures a momentary feeling rather than long-term loyalty
- Cultural differences can affect rating tendencies
- Doesn't always provide actionable insights without follow-up questions
Examples of Successful Implementation:
- Apple: Post-support interaction surveys requesting feedback on the helpfulness and efficiency of their support agents.
- Amazon: Post-purchase satisfaction ratings allowing customers to evaluate their buying experience and product quality.
- Zendesk: Offers built-in CSAT functionality used by thousands of companies to measure customer satisfaction across various support channels.
Tips for Effective CSAT Implementation:
- Keep surveys short and focused on the specific interaction.
- Follow up high or low scores with an open-ended question to gather more detailed feedback.
- Measure CSAT across different channels and touchpoints to identify areas for improvement.
- Compare CSAT trends over time rather than fixating on absolute numbers to understand performance and progress.
While CSAT is a crucial metric, it's important to understand how to effectively collect and utilize this feedback. For more in-depth strategies on measuring customer satisfaction and leveraging it for business growth, see Measuring Customer Satisfaction: Strategies to Boost Growth from Testimonial.
CSAT's place in the list of essential customer support metrics is solidified by its ability to provide a quick pulse check on customer happiness after individual interactions. This real-time feedback is invaluable for companies looking to continuously improve their customer support processes and create positive experiences. Whether you're a small e-commerce business, a global enterprise, or a digital agency, tracking CSAT is a crucial step towards understanding and enhancing customer satisfaction.
2. Net Promoter Score (NPS)
Net Promoter Score (NPS) is a crucial customer support metric that gauges customer loyalty and advocacy. It operates on a simple premise: asking your customers how likely they are to recommend your company, product, or service to a friend or colleague on a scale of 0-10. This seemingly straightforward question provides powerful insights into customer sentiment and can be a strong predictor of business growth. Based on their responses, customers are categorized into three groups: Promoters (9-10), Passives (7-8), and Detractors (0-6). Your NPS is then calculated by subtracting the percentage of Detractors from the percentage of Promoters, resulting in a score between -100 and +100. A higher score indicates a greater likelihood of customer loyalty, positive word-of-mouth referrals, and ultimately, business growth.
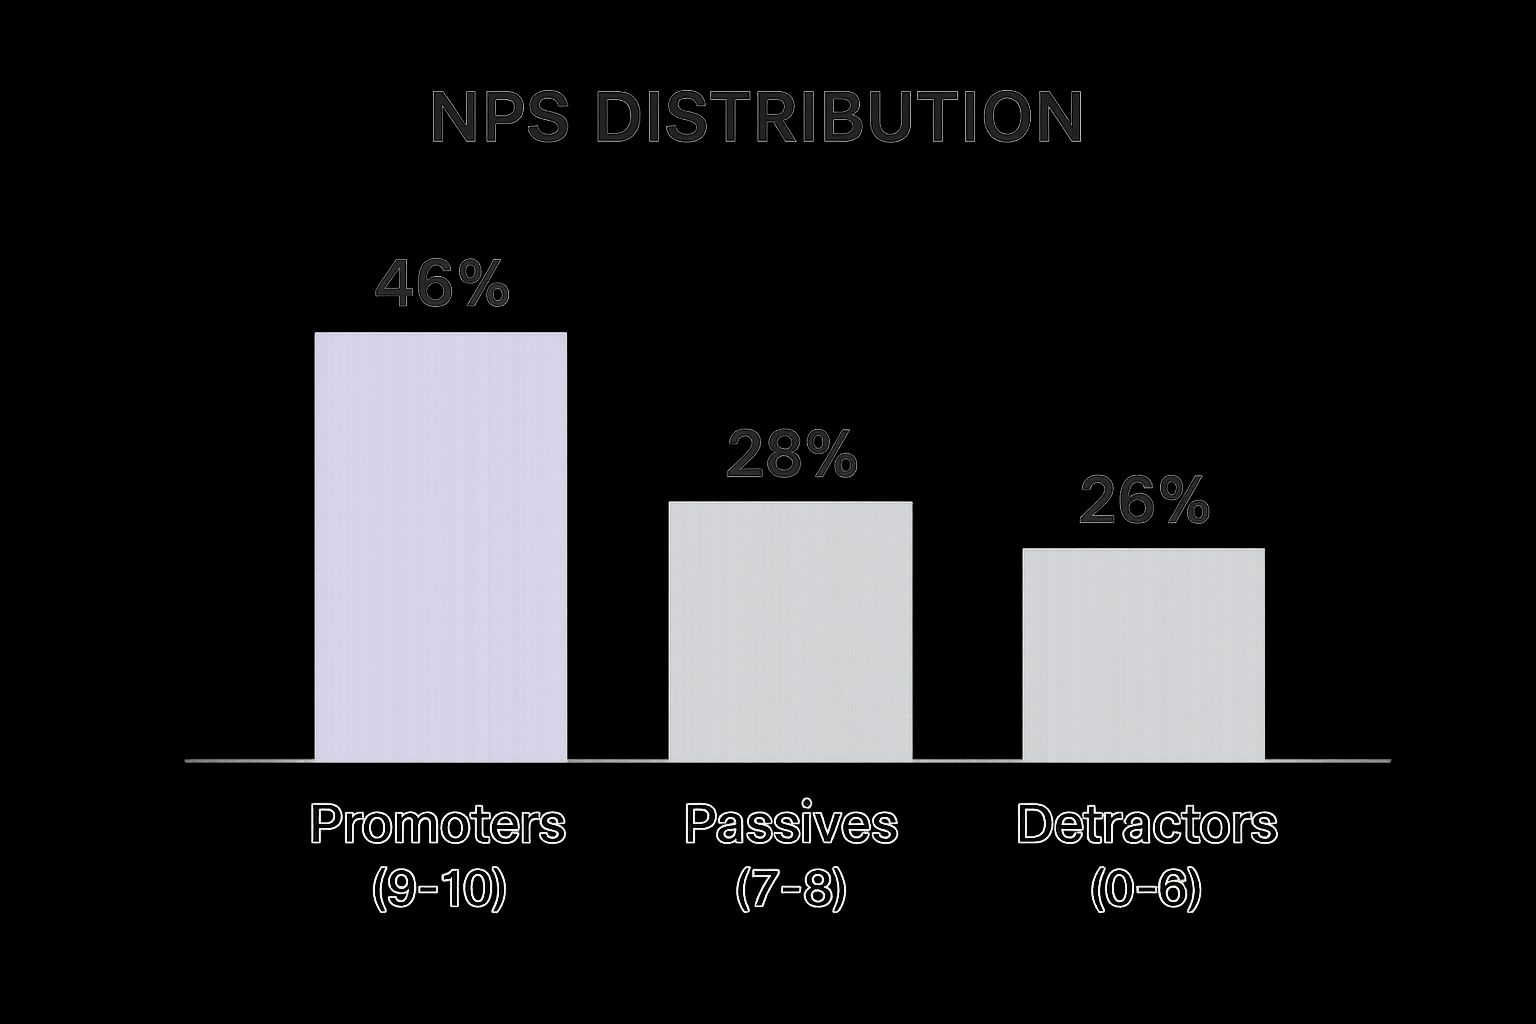
This infographic visually represents the NPS system, clearly demonstrating the scoring categories and their impact on the overall NPS calculation. The chart emphasizes the importance of Promoters in driving a positive score and highlights how a significant number of Detractors can quickly drag the overall NPS down. It also showcases the calculation method, subtracting the percentage of Detractors from the percentage of Promoters.
NPS deserves a place on this list of essential customer support metrics because it provides a clear, concise, and easily understood measure of customer loyalty. Its simplicity makes it easy to implement and track, while its strong correlation with business growth makes it a valuable tool for strategic decision-making. Features of NPS include its focus on customer loyalty and advocacy, its simple single-question format (with optional follow-up), its benchmarkability across industries, and its provision of a clear metric easily understood by executives. For businesses seeking scalable, 24/7 customer support, e-commerce retailers aiming to improve order management and response times, and customer service teams looking to automate repetitive inquiries and reduce costs, NPS provides valuable insights into customer satisfaction.
Pros:
- Strong correlation with business growth
- Easy for customers to understand and complete
- Provides a clear, actionable metric
- Can predict customer retention and word-of-mouth marketing effectiveness
Cons:
- Doesn't explain why customers would/wouldn't recommend
- Cultural differences can affect scoring patterns
- Single metric may oversimplify complex customer relationships
- Can fluctuate based on recent experiences rather than overall relationship
Examples of Successful Implementation:
- Apple consistently maintains NPS scores above 70.
- Airbnb uses NPS to identify hosts who deliver exceptional experiences.
- Intuit uses NPS to drive product improvements across their software suite.
Tips for Using NPS Effectively:
- Always include a follow-up question asking why customers gave their rating.
- Measure NPS consistently over time (quarterly is common).
- Segment NPS by customer type, product, and other relevant factors.
- Use NPS as a starting point for deeper customer experience research.
When and Why to Use NPS:
Use NPS to track overall customer loyalty, identify areas for improvement in your customer experience, and benchmark your performance against competitors. It's particularly useful for understanding the drivers of customer advocacy and predicting future business growth. Digital agencies offering AI-driven support solutions can leverage NPS to demonstrate the value proposition of their services to clients. Global enterprises requiring multilingual, round-the-clock customer engagement can utilize NPS to ensure consistent customer satisfaction across different regions and languages. Learn more about Net Promoter Score (NPS). This metric is vital for understanding customer sentiment and should be a cornerstone of any customer support strategy. The method was popularized by Fred Reichheld (Bain & Company), Satmetrix, and companies like Apple, Amazon, and Zappos.
3. First Contact Resolution (FCR)
First Contact Resolution (FCR) is a critical customer support metric that measures the percentage of customer inquiries resolved during the first interaction, eliminating the need for follow-ups, escalations, or additional contacts. This metric focuses on efficiency and effectiveness, directly impacting customer satisfaction as most customers prefer immediate resolution to their problems. A high FCR demonstrates a company's ability to handle customer issues effectively and efficiently from the outset. It’s a powerful indicator of both customer satisfaction and operational efficiency, making it a deserved entry on any list of essential customer support metrics.

FCR can be tracked across various communication channels, including phone, email, and chat. It typically involves a combination of system tracking (e.g., ticketing systems logging resolution status) and customer confirmation (e.g., post-interaction surveys). This multifaceted approach ensures a more accurate representation of true first contact resolution. Features of tracking FCR include measuring support efficiency and thoroughness, allowing channel-specific analysis, and providing insights into both agent performance and potential knowledge gaps.
Benefits of prioritizing FCR:
- Enhanced Customer Satisfaction: Resolving issues quickly and efficiently leads to happier customers.
- Reduced Operational Costs: Fewer repeat contacts translate to lower support costs and increased agent productivity.
- Improved Agent Training: Identifying areas where agents struggle allows for targeted training and knowledge base improvements.
- Thorough Problem-Solving: Encourages agents to focus on complete resolution rather than quick fixes.
Potential Drawbacks of focusing solely on FCR:
- Measurement Challenges: Accurately measuring FCR across different channels can be complex.
- Potential for Inefficient Practices: Overemphasis on FCR might lead agents to spend excessive time on single interactions or avoid necessary escalations to more experienced team members.
- Not Suitable for all Cases: Some complex issues inherently require multiple interactions for a satisfactory resolution.
- Benchmarking Difficulties: Variations in measurement methodologies can make it challenging to compare FCR performance against industry benchmarks.
Examples of Successful FCR Implementation:
- T-Mobile significantly boosted customer satisfaction and reduced costs by improving their FCR from 66% to 86%.
- Zappos prioritizes FCR by empowering agents to dedicate as much time as needed to resolve customer issues during the initial contact.
- Help Scout reports a strong correlation between FCR rates above 70% and significantly higher customer satisfaction levels.
Tips for Improving FCR:
- Clearly Define "Resolution": Establish clear definitions of what constitutes a "resolved" issue for different inquiry types.
- Combine System Tracking and Customer Confirmation: Use a combination of automated tracking and post-interaction surveys to verify resolution.
- Develop Comprehensive Knowledge Bases: Equipping agents with readily accessible information empowers them to resolve issues efficiently.
- Balance FCR with Average Handle Time: Strive for a balance between quick resolutions and ensuring quality service. Don't sacrifice thoroughness for speed.
Learn more about First Contact Resolution (FCR)
FCR is a valuable metric for businesses of all sizes, from e-commerce retailers seeking streamlined order management to global enterprises managing complex, multilingual support operations. By focusing on FCR, companies can improve customer satisfaction, reduce costs, and enhance overall support efficiency. This metric has been popularized by organizations like the Service Quality Measurement Group (SQM) and the International Customer Management Institute (ICMI), as well as contact center technology providers such as NICE and Genesys, further highlighting its significance within the customer service landscape.
4. Average Response Time
Average Response Time (ART) is a crucial customer support metric that measures the time it takes for a customer to receive an initial response after initiating contact. This initial response doesn't necessarily solve the issue, but acknowledges the customer's request and lets them know their query has been received. Monitoring and optimizing ART directly impacts customer satisfaction and perception of your business's responsiveness. It deserves a place on this list because it's a foundational metric, easily understood and implemented, yet powerfully indicative of overall customer service health.
How it Works:
ART is calculated by averaging the time elapsed between a customer submitting a support request (e.g., email, chat, phone call) and a support agent sending the first reply. This first reply can be from a human agent or an automated system. The clock starts ticking when the customer submits their request and stops when the first response is sent.
Features:
- Channel-dependent: Expected ART varies drastically across channels. Customers anticipate near-instantaneous responses on live chat (measured in seconds), slightly longer waits for phone calls (minutes), and the longest wait times for email (hours).
- Timeframe: You can measure ART 24/7 or only during business hours, depending on your support model.
- Segmentation: ART can be segmented by issue priority (e.g., urgent vs. low priority), product type, customer segment, or issue type, providing granular insights.
- Automation Inclusion: Automated responses, like auto-acknowledgments, are typically included in ART calculations.
Pros:
- Customer Perception: A quick response, even if it's just an acknowledgment, significantly improves the customer experience, showing them they've been heard and their issue is being addressed.
- Measurability: Most customer support platforms automatically track ART, making it easy to monitor and analyze.
- Workforce Optimization: ART data helps optimize staffing schedules to ensure adequate coverage during peak hours and reduce wait times.
- Problem Identification: Consistently high ART can be an early warning sign of understaffing, inefficient processes, or technical issues.
Cons:
- Quality vs. Speed: Prioritizing speed can sometimes lead to rushed, lower-quality responses. Agents under pressure to respond quickly may not fully understand the issue or provide accurate information.
- Agent Burnout: The constant pressure to meet strict ART targets can contribute to agent stress and burnout.
- Templated Responses: An overemphasis on speed can encourage the use of generic, templated responses that lack personalization and may not address the customer's specific needs.
- Limited Scope: ART only measures the speed of the initial response, not the quality, helpfulness, or effectiveness of the solution provided.
Examples of Successful Implementation:
- Zappos: Known for exceptional customer service, Zappos aims to answer 80% of calls within 20 seconds.
- Buffer: Buffer demonstrates transparency and accountability by publicly sharing their response time metrics.
- Amazon: Amazon's 'Contact Us' feature provides estimated wait times for different support channels, setting clear expectations for customers.
Actionable Tips:
- Channel-Specific Targets: Set realistic ART targets based on the specific channel and customer expectations.
- Automated Acknowledgments: Use auto-responders to acknowledge receipt of inquiries immediately, but clearly indicate that the response is automated.
- "Follow the Sun" Support: Implement a "follow the sun" support model with globally distributed teams to provide 24/7 coverage and minimize response times.
- Monitor Distribution: Don't just focus on the average. Monitor the distribution of response times (e.g., 90th percentile) to identify outliers and areas for improvement.
Popularized By:
The importance of ART has been emphasized by organizations like the International Customer Management Institute (ICMI), the Contact Center Association, and Help Scout's customer service benchmarks.
By focusing on and optimizing Average Response Time, businesses can significantly enhance customer satisfaction, build trust, and create a more positive overall customer experience.
5. Average Handle Time (AHT)
Average Handle Time (AHT) is a crucial customer support metric that measures the average duration of a customer interaction from start to finish. This includes the time spent actively talking to the customer, any hold time, and the essential after-call work required to fully resolve the issue. AHT is a key component of workforce management and plays a vital role in understanding and optimizing your customer support operations. Understanding and managing AHT is critical for businesses seeking scalable, 24/7 customer support, especially for e-commerce retailers aiming to improve order management and response times. For customer service teams looking to automate repetitive inquiries and reduce costs, AHT can highlight areas ripe for automation.
While traditionally viewed as a pure efficiency metric, modern customer support strategies emphasize a balance between AHT and quality. Simply aiming for the lowest possible AHT can negatively impact customer satisfaction. Recognizing that complex issues inherently require more time and attention leads to better resolutions and happier customers. This balanced approach resonates well with digital agencies offering AI-driven support solutions to their clients, allowing them to showcase the benefits of both efficiency and effectiveness.
How AHT Works:
AHT encompasses the entire interaction lifecycle, including:
- Talk Time: The actual conversation duration with the customer.
- Hold Time: The time the customer spends on hold.
- After-Call Work (Wrap-up Time): The time after the call spent on tasks like updating records, scheduling follow-ups, or escalating the issue.
This holistic view of the interaction ensures that AHT accurately reflects the total effort involved in resolution.
Features and Benefits:
- Total Interaction Time + Post-Interaction Work: Provides a comprehensive measure of the entire customer interaction.
- Variability by Issue Complexity and Channel: Allows for segmented analysis and targeted improvements.
- Impact on Staffing and Costs: Directly informs staffing requirements and budget allocation.
- Breakdown into Component Parts: Facilitates targeted process improvements by identifying bottlenecks in talk time, hold time, or wrap-up time. This granular data is valuable for global enterprises requiring multilingual, round-the-clock customer engagement, as it helps identify language-specific challenges or regional variations in support needs.
Pros:
- Drives Operational Efficiency: Enables better resource allocation and optimized workflows.
- Identifies Bottlenecks and Training Needs: Highlights areas where processes can be streamlined or agents require additional training.
- Forecasts Staffing Requirements: Allows for accurate prediction of staffing needs based on anticipated call volume and complexity.
- Uncovers Knowledge/System Issues: Consistently long AHT for specific issue types can indicate knowledge gaps or underlying system problems.
Cons:
- Potential for Reduced Quality: Overemphasis on speed can lead to rushed interactions and incomplete resolutions.
- Negative Impact on Agent Behavior: Pressure to reduce AHT can create stress and negatively impact agent morale.
- Not All Interactions Are Equal: Complex issues and sales opportunities often require longer handling times.
- Conflict with CSAT: Focusing solely on AHT can detract from customer satisfaction goals.
Examples of Successful Implementation:
- Zappos: Their famous record-breaking customer service call (over 10 hours) highlights their commitment to quality over speed.
- American Express: Their focus on 'Relationship Care' prioritizes building strong customer relationships over minimizing AHT.
- Amazon: While measuring AHT, their emphasis remains on fully resolving customer problems.
Actionable Tips:
- Segment AHT Expectations: Establish different AHT targets based on issue type and complexity.
- Optimize Processes and Systems: Streamline workflows and improve systems to reduce handle time without rushing agents.
- Balance AHT with Quality Metrics: Consider metrics like First Contact Resolution (FCR) and Customer Satisfaction (CSAT) alongside AHT.
- Use AHT for Training: Leverage AHT data to identify areas where agents require additional training or support.
AHT, when used strategically, is a powerful customer support metric. By understanding its nuances and implementing the tips above, businesses can leverage AHT to drive operational efficiency, improve agent performance, and ultimately, enhance the customer experience. This makes AHT a deserved inclusion in any list of essential customer support metrics.
6. Customer Effort Score (CES)
Customer Effort Score (CES) is a crucial customer support metric that gauges the ease with which customers can interact with your business and resolve their issues. Unlike traditional satisfaction surveys, CES focuses on the effort expended by the customer, recognizing that a frictionless experience is a key driver of loyalty. It typically involves asking customers to rate their agreement with a statement like "The company made it easy for me to handle my issue" on a numerical scale, often ranging from 1 (very difficult) to 7 (very easy).

CES deserves its place in any comprehensive suite of customer support metrics because it directly addresses the pain points in the customer journey. By pinpointing areas of high effort, businesses can proactively streamline processes and improve the overall customer experience, leading to increased loyalty and retention. This focus on reducing friction is particularly relevant for today's fast-paced, digitally-driven marketplace.
Features and Benefits:
- Focus on Ease: CES directly measures the ease of doing business, providing a clear picture of where customers encounter friction.
- Predictive Power: Research shows CES is a stronger predictor of customer loyalty than traditional satisfaction metrics.
- Actionable Insights: By identifying specific pain points, CES enables targeted improvements to processes and services.
- Reduced Bias: CES is less susceptible to cultural response biases that can sometimes skew satisfaction surveys.
- Scalability: CES can be easily implemented across various channels and touchpoints.
Pros:
- Directly measures friction points in customer journeys.
- Strong correlation with customer loyalty and retention.
- Identifies specific pain points for improvement.
- Less susceptible to cultural response biases than satisfaction metrics.
Cons:
- Relatively newer metric with less readily available benchmarking data.
- May not fully capture the emotional aspects of customer experience.
- Requires careful implementation to yield truly actionable insights.
- Doesn't always replace the need for satisfaction or loyalty metrics.
Examples of Successful Implementation:
- Amazon's 1-Click ordering: This streamlined purchasing process drastically reduced customer effort, contributing to Amazon's immense success.
- USAA's claims process redesign: Using CES feedback, USAA simplified their claims process, improving customer satisfaction and efficiency.
- Microsoft's technical support: CES helps Microsoft continuously refine their technical support processes, making it easier for customers to get assistance.
Actionable Tips for Implementation:
- Follow-up Questions: After the initial CES rating, ask open-ended questions like "What would have made this easier?" to gather qualitative data.
- Multi-Channel Measurement: Measure CES across all customer interaction channels (e.g., phone, email, chat, website) to identify channel-specific issues.
- Segmentation: Compare CES scores across different customer segments and issue types to uncover hidden trends and prioritize improvements.
- Prioritization: Focus on high-volume, high-effort interactions first to maximize impact and resource allocation.
When and Why to Use CES:
CES is particularly valuable for businesses seeking to:
- Improve customer retention: By reducing churn caused by frustrating experiences.
- Streamline customer journeys: Identifying and eliminating friction points across all touchpoints.
- Increase customer lifetime value: By fostering loyalty through effortless interactions.
- Optimize customer support processes: Identifying areas for improvement and training opportunities.
This makes CES a powerful tool for small and medium-sized businesses scaling their customer support, e-commerce retailers optimizing order management, customer service teams automating inquiries, digital agencies offering AI-driven support solutions, and global enterprises managing multilingual customer engagement. By leveraging CES, businesses can proactively address customer pain points, build stronger relationships, and ultimately drive sustainable growth. While popularized by Matthew Dixon, Karen Freeman, and Nicholas Toman (CEB, now Gartner) and highlighted in the Harvard Business Review article "Stop Trying to Delight Your Customers," the core principles of reducing customer effort are timeless and essential for any business focused on providing exceptional customer experiences.
7. Customer Retention Rate
Customer Retention Rate (CRR) is a crucial customer support metric that measures the percentage of customers who stay with your company over a defined period. For subscription-based businesses, this translates to customers who renew their subscriptions. For other business models, it typically refers to customers who make repeat purchases. Its position on this list of essential customer support metrics is solidified by its direct link to revenue and profitability, demonstrating the impact of effective support on a company's bottom line.
How it Works:
CRR is calculated over specific time frames, such as monthly, quarterly, or annually. It provides a clear picture of customer loyalty and the effectiveness of your efforts to keep them engaged. You calculate CRR using this formula:
[(# of Customers at End of Period - # of New Customers Acquired During Period) / # of Customers at Start of Period] * 100%
For example, if you started the quarter with 100 customers, gained 20 new customers, and ended with 110 customers, your CRR is [(110 - 20) / 100] * 100% = 90%. This indicates that you retained 90% of your existing customers during that quarter.
Features and Benefits:
- Period-Specific Measurement: CRR is measured over specific time periods, allowing you to track trends and identify potential issues promptly.
- Segmentation: You can segment CRR by customer type, product line, or region to gain deeper insights into customer behavior.
- Revenue Impact: CRR is directly tied to revenue sustainability and growth. Retaining customers is significantly more cost-effective than acquiring new ones.
- Churn Rate Correlation: CRR is the inverse of churn rate. Understanding both provides a comprehensive view of customer lifecycle dynamics.
Pros:
- Profitability: Acquiring new customers costs 5-25 times more than retaining existing ones. A high CRR directly impacts business profitability.
- Relationship Health: CRR provides a clear indication of the overall health of your customer relationships.
- Trend Identification: It helps identify seasonal patterns or trends in customer behavior.
- Support Value Demonstration: CRR can be correlated with support interactions to demonstrate the value of effective customer service.
Cons:
- Lack of Insight into Reasons: CRR doesn't explain why customers stay or leave. Further investigation is required.
- External Factors: Many factors beyond support quality can affect retention, such as market competition and economic conditions.
- Masking Problems: Measuring CRR only in aggregate can mask problems within specific customer segments.
- Industry Limitations: Certain industries, like those selling one-time purchase products, may have a natural ceiling for CRR.
Examples of Successful Implementation:
- Netflix: Closely monitors monthly retention and correlates it with customer support interactions to optimize service delivery.
- Salesforce: Achieved a 95%+ retention rate partly through their robust customer success and support model.
- Adobe: Saw significant retention improvement after switching from one-time purchases to a subscription model with ongoing support.
Actionable Tips:
- Comparative Analysis: Compare the retention rates of customers who contacted support with those who didn't. This can highlight areas for improvement in your support processes.
- Issue Analysis: Analyze the retention impact of different issue types and the quality of their resolution. This helps prioritize support efforts.
- Retention Teams: Implement 'save teams' specifically focused on retaining at-risk customers.
- Proactive Support: Create proactive support programs for high-value customers to nurture loyalty and prevent churn.
Why CRR Deserves its Place:
In today’s competitive landscape, customer retention is paramount for sustainable growth. For the target audience—small and medium-sized businesses, e-commerce retailers, customer service teams, digital agencies, and global enterprises—understanding and optimizing CRR is essential. CRR directly impacts the bottom line and provides valuable insights into the effectiveness of customer support strategies, making it a critical metric for any business striving for long-term success. By focusing on CRR, businesses can build stronger customer relationships, reduce churn, and maximize profitability.
8. Cost per Resolution
Cost per Resolution (also called Cost per Ticket or Cost per Contact) is a crucial customer support metric that measures the average expense a business incurs to resolve a customer issue, from initial contact to final resolution. This metric provides valuable insights into the efficiency of your support operations, allowing you to identify areas for improvement and ensure you're delivering effective support without overspending. It deserves its place on this list because, in the pursuit of excellent customer service, it’s vital to balance quality with cost-effectiveness. Understanding your Cost per Resolution empowers you to make data-driven decisions about resource allocation and process optimization.
How it Works:
Calculating Cost per Resolution involves totaling all support-related expenses over a specific period and dividing it by the number of resolved tickets during that same timeframe. This includes:
- Personnel Costs: Agent salaries, benefits, and training.
- Technology Costs: Software licenses, hardware, and maintenance for support tools (CRM, helpdesk, etc.).
- Overhead Costs: Rent, utilities, and other indirect expenses allocated to the support team.
Features and Benefits:
- Combines all costs: Provides a holistic view by incorporating personnel, technology, and overhead.
- Channel Breakdown: Enables comparison of costs across different support channels (phone, email, chat, social media). This allows for identification of the most cost-effective channels for different issue types.
- Segmentation: Can be segmented by issue complexity or type for more granular analysis. For instance, you can compare the Cost per Resolution for simple password resets versus complex technical troubleshooting.
- Budgeting: Directly impacts support budget planning and resource allocation.
Pros:
- Financial Visibility: Offers a clear picture of support spending and resource utilization.
- Investment Justification: Helps justify investments in self-service options, automation, and other efficiency-boosting initiatives.
- Cost-Benefit Analysis: Enables informed decision-making about support improvement projects.
- Channel Optimization: Allows for comparison of costs across different communication channels.
Cons:
- Potential for Negative Impact on Customer Experience: Overemphasis on reducing costs can lead to shortcuts that damage the customer experience.
- Customer Value Variance: Doesn't inherently account for the different value of different customers (e.g., high-value clients may warrant higher support costs).
- Incentivizes Quick Fixes: Can encourage agents to prioritize speed over thorough resolutions.
- Complexity of Calculation: Can be challenging to calculate accurately, especially with shared resources across multiple teams.
Examples of Successful Implementation:
- IBM reportedly reduced its Cost per Resolution by 25% by implementing better knowledge management systems, empowering agents to resolve issues more efficiently.
- Intuit invested in AI-powered self-service tools, which reduced Cost per Resolution while simultaneously increasing customer satisfaction.
- Zappos consciously maintains a higher-than-average Cost per Contact as part of their customer-centric service philosophy, prioritizing excellent service over strict cost control.
Actionable Tips:
- Balance with Quality: Always balance cost metrics with quality metrics like Customer Satisfaction (CSAT) and First Contact Resolution (FCR).
- Segment for Insights: Segment costs by issue type to identify optimization opportunities. Learn more about Cost per Resolution to understand best practices for cost reduction.
- Invest in Deflection: Implement strategies like FAQs, knowledge bases, and chatbots to deflect common, simple inquiries and reduce agent workload.
- Consider Customer Lifetime Value: Factor in the lifetime value of your customers when analyzing support costs. Spending more on support for high-value customers can be a worthwhile investment.
When and Why to Use This Approach:
Cost per Resolution is essential for any business seeking to optimize its customer support operations. It is especially relevant for:
- Small and medium-sized businesses: Scalable, 24/7 support is often a necessity, and understanding Cost per Resolution helps ensure efficient resource utilization.
- E-commerce retailers: Managing order inquiries and ensuring timely responses are crucial. Analyzing Cost per Resolution can help streamline processes and reduce costs.
- Customer service teams: Automating repetitive inquiries and reducing costs are key objectives. This metric provides the necessary data for informed decisions.
- Digital agencies: Offering AI-driven support solutions to clients requires demonstrating cost-effectiveness.
- Global enterprises: Multilingual, round-the-clock customer engagement can be expensive. Cost per Resolution helps manage and optimize these complex operations.
Customer Support Metrics Overview
| Metric | 🔄 Implementation Complexity | 🧰 Resource Requirements | ⭐ Expected Outcomes | 💡 Ideal Use Cases | ⚡ Key Advantages |
|---|---|---|---|---|---|
| Customer Satisfaction Score (CSAT) | Low - simple surveys, easy to deploy | Low - minimal tools needed, often built into platforms | Measures immediate satisfaction percentage | Post-interaction feedback, channel comparison | Quick collection, high response rates |
| Net Promoter Score (NPS) | Low - single-question survey with follow-up | Low - simple survey tools, requires periodic measurement | Loyalty and likelihood to recommend | Tracking overall customer loyalty & advocacy | Clear, actionable metric tied to growth |
| First Contact Resolution (FCR) | Moderate - requires system tracking + confirmation | Medium - multi-channel tracking and agent training | Efficiency in issue resolution | Measuring support effectiveness & training needs | Reduces repeat contacts, correlates with satisfaction |
| Average Response Time | Moderate - depends on channel complexities | Medium - real-time tracking tools and scheduling | Customer perception of service speed | Workforce optimization, multi-channel support | Immediate indicator of staffing and process issues |
| Average Handle Time (AHT) | Moderate - requires detailed time tracking | Medium - call, hold, and after-call work tracking | Operational efficiency and capacity planning | Process improvement, staffing and training | Identifies bottlenecks, balances speed & quality |
| Customer Effort Score (CES) | Low - short surveys post interactions | Low - survey integration, data segmentation | Measures ease of customer interactions | Identifying friction points in customer journeys | Predicts loyalty better than satisfaction |
| Customer Retention Rate | Moderate - needs longitudinal tracking | Medium - CRM and subscription data analysis | Percentage of customers retained over time | Subscription or repeat-purchase model tracking | Direct link to profitability and growth |
| Cost per Resolution | Moderate to High - requires cost accounting | Medium to High - tracks personnel, tech & overhead | Average cost efficiency of issue resolution | Budget planning and operational cost control | Enables cost-benefit and channel optimization |
Putting Customer Support Metrics to Work
Mastering customer support metrics is crucial for understanding and improving the customer experience. This article explored eight key metrics, from CSAT and NPS for gauging overall satisfaction, to FCR, Average Response Time, and AHT for assessing efficiency, and CES, Customer Retention Rate, and Cost per Resolution for measuring the long-term impact of your support efforts. To explore more detailed customer service KPIs, visit our guide on customer service KPIs. By regularly tracking and analyzing these customer support metrics, you gain valuable insights into what's working, what needs improvement, and where to focus your resources. This data-driven approach empowers you to optimize processes, personalize interactions, and ultimately create a customer-centric culture that differentiates your business and fuels growth.
The most important takeaway is that customer support metrics aren't just numbers; they represent the voice of your customers. By actively listening to that voice and using data to guide your decisions, you can build stronger relationships, reduce churn, and create a truly exceptional customer experience. This translates to improved customer loyalty, increased revenue, and a sustainable competitive advantage in today’s dynamic market. Don't just react to customer issues – proactively address them by leveraging the power of customer support metrics.
Ready to transform your customer support operations and unlock the full potential of your customer experience? FlowGent AI can help you efficiently track, analyze, and act on key customer support metrics, automating tasks and optimizing your workflow for maximum impact. Learn more about how FlowGent AI can empower your team and elevate your customer support at FlowGent AI.