


Unlocking Customer Service Excellence: The Power of KPIs
This listicle provides a comprehensive guide to eight essential customer service performance indicators (KPIs). Learn how to define, measure, and benchmark these KPIs to enhance your customer service operations. We'll cover practical tips and real-world examples applicable to businesses of all sizes. Mastering these KPIs is crucial for driving customer satisfaction, loyalty, and growth. For a deeper understanding of best practices and strategies for customer service, resources like the Notaku Docs can offer valuable insights. These Docs from Notaku provide additional context and details.
This list will explore key performance indicators for customer service:
- customer satisfaction score calculation: Measuring direct customer feedback.
- Net Promoter Score (NPS): Gauging customer loyalty and advocacy.
- First Call Resolution (FCR): Tracking efficiency and effectiveness.
- Average Response Time: Analyzing speed and responsiveness.
- Customer Effort Score (CES): Evaluating ease of interaction.
- Customer Retention Rate: Measuring customer loyalty over time.
- Average Handle Time (AHT): Optimizing agent productivity.
- Service Level Agreement (SLA) Compliance: Meeting service delivery standards.
- customer interaction analytics: Gaining deeper insights into customer-agent conversations to enhance service quality.
By understanding these KPIs, you can identify areas for improvement and optimize your customer service strategy for greater success. This guide offers actionable advice, moving beyond surface-level explanations to provide a practical approach to KPI implementation. Whether you're aiming to automate inquiries or improve response times, this comprehensive resource helps identify the KPIs that matter most for your business goals.
Turn Instagram DMs into booked calls
AI that qualifies leads, handles objections, and follows up - so you don't have to.
1. Customer Satisfaction Score (CSAT)
Customer Satisfaction Score (CSAT) is a key customer service performance indicator that directly measures customer happiness with a specific interaction, product, or service. It gauges how well you meet customer expectations at various touchpoints. CSAT surveys typically ask customers to rate their satisfaction on a numerical scale (e.g., 1-5 or 1-10). These scores are then aggregated and expressed as a percentage of satisfied customers. Tracking CSAT allows businesses to pinpoint areas for improvement and enhance the overall customer experience.
Why Use CSAT?
CSAT provides immediate feedback on specific interactions. This allows businesses to quickly address negative experiences and proactively improve service delivery. High CSAT scores correlate with increased customer loyalty and positive word-of-mouth referrals. Conversely, consistently low scores can signal underlying problems that need immediate attention. By actively monitoring CSAT, businesses gain actionable insights to optimize customer journeys and drive business growth. To deliver outstanding customer support and boost your business, here's some critical info on mastering KPIs: Master Customer Support KPIs for Business Success
Examples of CSAT in Action
Many successful companies leverage CSAT. Amazon uses post-purchase satisfaction surveys to gauge customer happiness with their orders. Uber relies on a ride rating system to evaluate driver performance and passenger satisfaction. Airlines utilize post-flight surveys to assess in-flight service and overall travel experience. Hotel booking platforms like Booking.com use CSAT for service ratings. These diverse examples highlight the versatility and applicability of CSAT across various industries.
Tips for Effective CSAT Implementation
- Timely Surveys: Send surveys immediately following the interaction for the most accurate feedback. Memories fade quickly, so prompt delivery is crucial.
- Brevity is Key: Keep surveys short and focused (3-5 questions maximum) to avoid survey fatigue and maximize completion rates.
- Consistent Scales: Maintain consistent rating scales (e.g., 1-5) across all customer touchpoints to ensure reliable comparisons and trend analysis.
- Segmentation: Segment CSAT results by customer demographics and interaction types to identify specific areas of strength and weakness.
- Follow Up: Reach out personally to customers who provide low satisfaction scores to address their concerns and demonstrate your commitment to their happiness.
Visualizing CSAT Performance
The infographic below compares three key CSAT percentages: the industry average, the company's current score, and the target benchmark. This comparison provides valuable context and highlights areas for improvement.
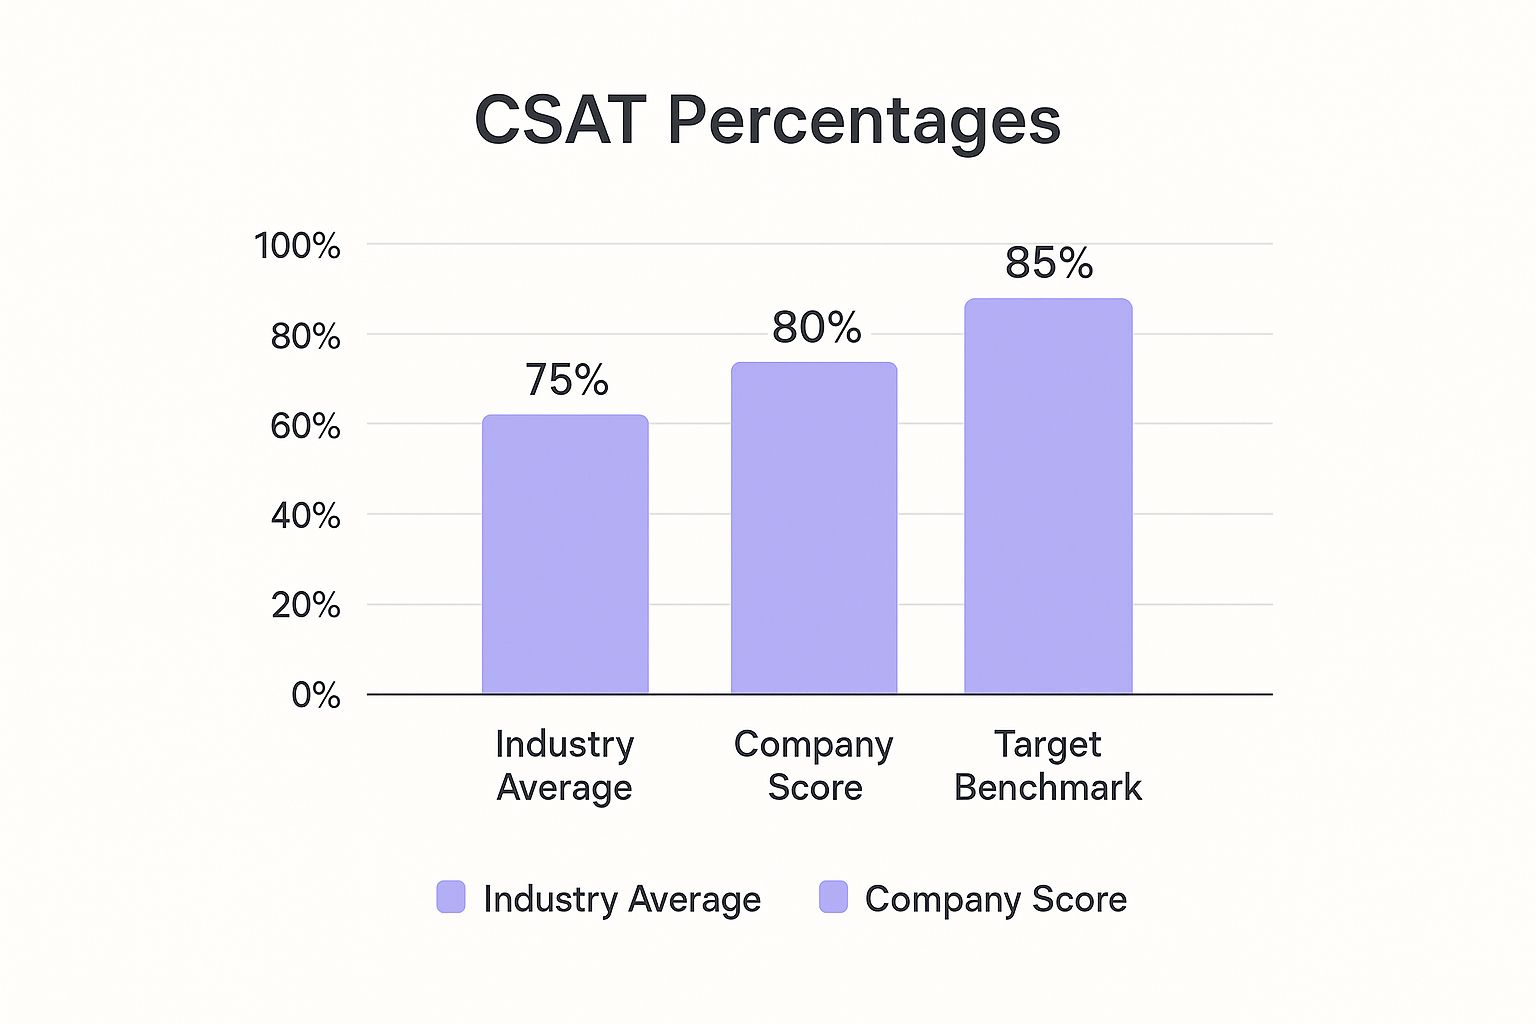
The bar chart visually demonstrates that while the company’s CSAT score (80%) exceeds the industry average (75%), it still falls short of the desired target benchmark (85%). This visual representation emphasizes the need for continued improvement and underscores the importance of striving for excellence in customer satisfaction. By regularly monitoring and analyzing CSAT data, businesses can identify areas for improvement, optimize customer experiences, and enhance overall performance.
2. Net Promoter Score (NPS)
Net Promoter Score (NPS) is a customer service performance indicator that measures customer loyalty and the likelihood of recommendations. It gauges the overall customer relationship with your brand. NPS is based on a single question: "On a scale of 0 to 10, how likely are you to recommend our company/product/service to a friend or colleague?" Based on their responses, customers are categorized into three groups: Promoters (9-10), Passives (7-8), and Detractors (0-6). Calculating NPS involves subtracting the percentage of Detractors from the percentage of Promoters.

Why Use NPS?
NPS provides a valuable snapshot of customer loyalty and advocacy. High NPS scores correlate with increased customer retention, positive word-of-mouth referrals, and sustainable business growth. Tracking NPS allows businesses to identify potential brand ambassadors (Promoters) and address the concerns of dissatisfied customers (Detractors). To effectively measure customer satisfaction, consider using targeted surveys. Explore practical examples of useful CSAT survey questions. This resource from Testimonial Donut provides 8 key CSAT survey questions to boost customer happiness. By actively monitoring NPS, businesses gain insights into customer sentiment and identify areas for improvement in customer experience.
Examples of NPS in Action
Many leading companies leverage NPS. Apple consistently maintains NPS scores above 70, reflecting strong customer loyalty. Tesla frequently reports NPS scores exceeding 90 in the automotive industry. Southwest Airlines uses NPS to track customer advocacy and improve its services. Even in the B2B space, companies like Slack have achieved high NPS scores (above 60), demonstrating the metric's versatility across various industries.
Tips for Effective NPS Implementation
- Include Follow-Up Questions: Ask "Why?" after the initial NPS question to understand the reasoning behind customer ratings.
- Optimal Timing: Survey customers at key moments in their journey, such as after a purchase or a successful customer service interaction.
- Segmentation: Analyze NPS by customer segments to identify specific areas of strength and weakness.
- Close the Loop: Address Detractor feedback promptly (within 24-48 hours) to mitigate negative experiences and demonstrate a commitment to customer satisfaction.
- Track Trends: Focus on NPS trends over time rather than fixating on single scores to gain a deeper understanding of customer loyalty dynamics.
Popularized By
NPS was popularized by Fred Reichheld of Bain & Company and Satmetrix. They introduced the concept as a key measure of customer loyalty and a predictor of business growth. Since its inception, NPS has become a widely adopted customer service performance indicator across various industries.
3. First Call Resolution (FCR)
First Call Resolution (FCR) is a crucial customer service performance indicator that measures the percentage of customer issues resolved during the initial contact. This means addressing the customer's problem completely without requiring follow-up calls, emails, or escalations. A high FCR demonstrates efficiency, competence, and a commitment to a positive customer experience. It directly impacts customer satisfaction and operational costs.
Why Use FCR?
FCR provides valuable insight into the effectiveness of your customer service processes. High FCR rates translate to lower operating costs by reducing the need for multiple interactions. This frees up agents to handle more inquiries, improving overall efficiency. Satisfied customers are more likely to remain loyal and recommend your business, leading to increased revenue and a stronger brand reputation. Monitoring FCR helps pinpoint areas for improvement in agent training, knowledge management, and process optimization. Learn more about customer support metrics at this helpful resource.
Examples of FCR in Action
Several companies prioritize and successfully implement FCR. Zappos empowers its customer service agents with decision-making authority, leading to a remarkable 75% FCR. American Express maintains high FCR through comprehensive agent training, ensuring that representatives are equipped to handle a wide range of customer inquiries effectively. Dell improved its FCR by 15% through better knowledge management systems, giving agents quick access to the information they need. Comcast uses FCR as a key metric for call center performance, demonstrating its commitment to efficient customer service.
Tips for Effective FCR Implementation
- Invest in Training: Comprehensive agent training and readily available knowledge bases are fundamental for high FCR. Agents should be equipped to handle diverse customer issues efficiently.
- Empower Agents: Provide agents with the authority to make decisions and resolve problems on the first call. This eliminates the need for escalations and lengthy resolution processes.
- Robust CRM Systems: Implement robust CRM systems that provide agents with complete customer history and interaction details. This allows for personalized and efficient service delivery.
- Define Resolution: Establish clear criteria for what constitutes a resolution. This ensures consistent tracking and accurate measurement of FCR.
- Monitor and Analyze: Track FCR by issue type, channel, and agent. This allows you to identify specific areas of strength and weakness and target improvement efforts effectively.
By regularly monitoring and analyzing FCR data, businesses can optimize their customer service processes, reduce costs, and enhance overall customer satisfaction. This results in increased customer loyalty, improved brand reputation, and sustained business growth.
4. Average Response Time
Average Response Time (ART) is a critical customer service performance indicator that measures how quickly your team responds to customer inquiries across various communication channels. These channels include phone calls, emails, live chat, social media messages, and support tickets. ART directly impacts customer satisfaction as prompt responses demonstrate responsiveness and attentiveness. Tracking and optimizing ART is essential for meeting customer expectations and building positive relationships.
Why Use Average Response Time?
ART offers valuable insights into the efficiency and effectiveness of your customer service operations. Monitoring ART allows businesses to identify bottlenecks, optimize workflows, and improve overall response times. Reduced response times contribute significantly to increased customer satisfaction, loyalty, and positive word-of-mouth referrals. Conversely, long wait times can lead to frustration, negative reviews, and even customer churn. Learn more about how to improve customer service response time at Flowgent.ai.
Examples of Average Response Time in Action
Several successful companies prioritize and excel at maintaining low ARTs. Buffer, a social media management platform, maintains an average email response time of 14 hours. Shopify, an e-commerce platform, aims for under 2-minute chat response times to ensure quick support for their merchants. HubSpot, a marketing software company, targets same-day responses for support tickets, demonstrating their commitment to customer service. Even on fast-paced platforms like Twitter, many customer service accounts often respond within 30 minutes. These examples highlight the importance of prioritizing response times across various platforms and industries.
Tips for Effective Average Response Time Management
- Channel-Specific Targets: Set different ART targets for various communication channels. Live chat typically demands faster responses than email, while complex technical issues may require more time than simple inquiries.
- Automation for Acknowledgment: Use automated responses to acknowledge receipt of inquiries and provide estimated response times. This manages customer expectations while allowing agents time to formulate thorough responses.
- Time-Based Monitoring: Monitor ART by time of day and day of the week to identify peak periods and allocate resources accordingly. This ensures adequate staffing during high-volume periods.
- Escalation Procedures: Implement clear escalation procedures for time-sensitive or complex issues that require immediate attention. This prevents delays and ensures timely resolution.
- Balance Speed with Quality: While speed is important, prioritize the quality of responses. Provide accurate and helpful information rather than rushed and incomplete answers.
5. Customer Effort Score (CES)
Customer Effort Score (CES) is a crucial customer service performance indicator that measures how easily customers can resolve their issues or achieve their goals. It focuses on the effort required from the customer's perspective, reflecting the simplicity and efficiency of the customer journey. CES surveys typically ask customers to rate the effort involved on a numerical scale (e.g., 1-5 or 1-7), where lower scores indicate a smoother, more effortless experience. Tracking CES allows businesses to identify pain points in the customer journey and streamline processes to reduce friction and enhance customer satisfaction.

Why Use CES?
CES provides valuable insights into the ease of customer interactions. This allows businesses to proactively identify and address areas of friction within the customer journey. A low CES score correlates with higher customer loyalty and reduced churn, as effortless experiences foster positive customer relationships. Conversely, high CES scores signal potential problems that require immediate attention. By monitoring and optimizing CES, businesses can create seamless customer experiences that drive satisfaction and boost retention.
Examples of CES in Action
Leading companies recognize the importance of minimizing customer effort. Google uses CES to optimize their support portal, ensuring users can quickly find answers and solutions. Microsoft measures CES for their Office 365 support processes, streamlining troubleshooting and assistance. Airbnb tracks CES for booking and check-in processes, simplifying travel arrangements for their users. Salesforce applies CES to measure the ease of using their help center, enhancing customer self-service capabilities. These examples showcase the versatility of CES across various industries.
Tips for Effective CES Implementation
- Timely Surveys: Send CES surveys immediately after the interaction for the most accurate feedback. Real-time data captures the immediacy of the customer's experience.
- Clear Language: Use simple and unambiguous language in survey questions. Avoid jargon and technical terms to ensure clarity and accurate responses.
- Specific Interactions: Focus on specific interactions rather than general experiences. This targeted approach provides actionable insights for improvement.
- Qualitative Feedback: Combine CES data with qualitative feedback. Understanding the "why" behind the scores allows for deeper analysis and more effective solutions.
- Track Trends: Monitor CES trends over time to measure improvement and identify recurring issues. Consistent tracking provides valuable data for ongoing optimization.
Visualizing CES Performance (Example)
Imagine a company's current CES score is 3.5 on a scale of 1-7 (1 being very low effort and 7 being high effort). This score could be visualized against their past scores to understand the improvement, to industry averages, and to competitor data if available. This visual comparison provides context for evaluating performance and identifying areas for improvement. Monitoring and analyzing CES data enables businesses to optimize customer journeys and deliver smoother, more effortless experiences that build loyalty and enhance customer lifetime value.
6. Customer Retention Rate
Customer Retention Rate (CRR) is a critical customer service performance indicator that measures the percentage of customers a business retains over a specific period. It provides valuable insights into customer loyalty, the effectiveness of customer service strategies, and the overall health of customer relationships. Calculating CRR involves comparing the number of customers at the beginning of a period to the number remaining at the end, accounting for new customer acquisitions. Tracking CRR allows businesses to identify trends, predict future revenue, and implement proactive measures to enhance customer loyalty.
Why Use Customer Retention Rate?
CRR is a powerful indicator of long-term business sustainability. Acquiring new customers is significantly more expensive than retaining existing ones. A high CRR indicates strong customer satisfaction, effective service delivery, and positive word-of-mouth referrals. By focusing on retention, businesses can reduce marketing costs, increase customer lifetime value, and build a loyal customer base. Understanding and improving CRR is essential for sustained business growth and profitability.
Examples of Customer Retention Rate in Action
Several leading companies prioritize and excel at customer retention. Netflix boasts a remarkable 93% monthly retention rate, highlighting the effectiveness of its content library and user experience. Amazon Prime maintains an impressive 96% retention rate for its members, driven by the value and convenience it offers. Spotify achieves a 95% retention rate among premium subscribers, showcasing the strength of its music streaming service. Salesforce, a prominent CRM platform, maintains a 90%+ retention rate in the enterprise segment, demonstrating the value and stickiness of its product. These examples underscore the importance of CRR across diverse industries.
Tips for Effective Customer Retention Rate Improvement
- Segmentation: Segment retention rates by customer value and demographics to identify specific areas for improvement.
- Early Warning Signs: Identify early warning signs of customer churn, such as decreased engagement or negative feedback.
- Proactive Strategies: Implement proactive retention strategies, including personalized offers, loyalty programs, and exceptional customer service.
- Cohort Analysis: Track retention by cohorts to identify trends and patterns in customer behavior over time.
- High-Value Customers: Focus on improving the retention of high-value customers who contribute significantly to revenue. Learn more about customer retention strategies from this helpful resource: Learn more about...
Visualizing Customer Retention Rate Performance
While a specific infographic isn't included here, imagine a line graph depicting CRR over time. This visualization would reveal trends, seasonal fluctuations, and the impact of retention initiatives. Comparing current CRR to industry benchmarks and internal targets provides valuable context and highlights areas for improvement. By regularly monitoring and analyzing CRR data, businesses can optimize customer experiences, strengthen customer relationships, and drive sustainable growth.
7. Average Handle Time (AHT)
Average Handle Time (AHT) is a crucial customer service performance indicator that measures the average duration agents spend handling customer interactions. This includes talk time, hold time, and any after-call work required to resolve the issue. AHT serves as a key efficiency metric, enabling businesses to optimize staffing levels, control operational costs, and maintain service quality. By monitoring and analyzing AHT, companies can identify bottlenecks, streamline processes, and improve overall customer experience.
Why Use AHT?
AHT provides valuable insights into operational efficiency and agent performance. Tracking AHT allows businesses to identify areas where agents might be struggling, enabling targeted training and process improvements. Lowering AHT can lead to significant cost savings by reducing the need for excessive staffing. However, it's essential to balance AHT with customer satisfaction, as overly aggressive reductions in handle time can negatively impact service quality.
Examples of AHT in Action
Many successful companies leverage AHT to optimize their customer service operations. Geico, known for its efficient claims processing, maintains a target AHT of approximately six minutes for insurance claims. American Airlines aims for a four-minute AHT for reservation calls, streamlining the booking process for passengers. Chase Bank strives for a three-minute AHT for routine banking inquiries, ensuring quick and efficient service for its customers. Verizon, recognizing the varying complexity of customer issues, tracks AHT separately for technical support and billing inquiries.
Tips for Effective AHT Implementation
- Set Realistic Targets: Establish AHT targets based on the complexity of the issue. Differentiate between simple inquiries and complex technical problems.
- Comprehensive Training: Provide agents with thorough training on products, services, and internal systems. This empowers them to handle inquiries efficiently and effectively.
- Knowledge Management Systems: Implement knowledge management systems to provide agents with quick access to relevant information, reducing research time and improving first-call resolution rates.
- Balanced Approach: Monitor AHT alongside customer satisfaction and quality metrics. Avoid sacrificing service quality for speed.
- Analyze Outliers: Investigate AHT outliers (both high and low) to identify best practices and areas for improvement. Learn from top performers and address issues contributing to excessively long handle times.
8. Service Level Agreement (SLA) Compliance
Service Level Agreement (SLA) compliance is a crucial customer service performance indicator that measures how effectively your operations meet predefined service standards and commitments. It tracks adherence to specific performance targets, such as response times, resolution times, and system availability. Essentially, it quantifies how well you keep your promises to customers regarding service delivery. Monitoring SLA compliance allows businesses to identify areas where service delivery falls short and implement corrective actions to improve performance.
Why Use SLA Compliance?
Tracking SLA compliance is essential for managing customer expectations and ensuring service consistency. Clearly defined SLAs provide a framework for service delivery and accountability. Meeting or exceeding these agreements builds trust and strengthens customer relationships. Conversely, consistently failing to meet SLAs can damage your reputation and lead to customer churn. By actively monitoring SLA compliance, businesses can proactively address service gaps and maintain a high level of customer satisfaction.
Examples of SLA Compliance in Action
Many companies utilize SLAs to guarantee service quality. Amazon Web Services (AWS) guarantees 99.99% uptime for many of its cloud services. Microsoft Office 365 commits to a 99.9% availability SLA. Zendesk offers tiered response time SLAs based on ticket priority, ensuring urgent issues receive prompt attention. ServiceNow uses resolution time SLAs for various incident types, allowing customers to understand expected resolution timelines. These diverse examples showcase the importance of SLAs across various industries.
Tips for Effective SLA Implementation
- Set Realistic and Achievable Targets: Base SLA targets on historical data, industry benchmarks, and operational capabilities. Avoid setting unrealistic expectations that can't be consistently met.
- Regular Review and Update: Periodically review and update SLAs based on evolving business needs, customer expectations, and performance data. Regular adjustments ensure SLAs remain relevant and effective.
- Transparent Communication: Communicate SLA performance transparently to customers. Sharing this data builds trust and demonstrates your commitment to service quality.
- Identify Improvement Opportunities: Use SLA data to pinpoint areas for improvement in your service delivery processes. Analyzing trends and identifying bottlenecks can lead to targeted enhancements.
- Balanced Metrics: Track multiple SLA metrics to avoid tunnel vision. Balancing response times, resolution times, and other relevant indicators provides a comprehensive view of service performance.
Customer Service KPI Comparison
| Metric | Implementation Complexity 🔄 | Resource Requirements ⚡ | Expected Outcomes 📊 | Ideal Use Cases 💡 | Key Advantages ⭐ |
|---|---|---|---|---|---|
| Customer Satisfaction Score (CSAT) | Low - simple surveys and rating scales | Low - easy survey deployment | Immediate feedback on specific interactions, % satisfied customers | Quick feedback, service/product evaluation | Easy to implement, cost-effective, high response rates |
| Net Promoter Score (NPS) | Low - single-question survey | Low - minimal survey resources | Measures customer loyalty and advocacy, benchmarkable | Loyalty tracking, competitive benchmarking | Strong growth correlation, simple, widely adopted |
| First Call Resolution (FCR) | Medium - requires tracking systems | Medium - CRM and multi-channel support | Improved service efficiency, reduced costs, higher satisfaction | Contact centers aiming to reduce repeat issues | Reduces call volume, boosts agent productivity |
| Average Response Time | Medium - continuous real-time monitoring | Medium - tracking tools and automation | Faster response improves customer satisfaction and SLA compliance | Multi-channel support teams, SLA monitoring | Directly measurable, aids staffing and SLA compliance |
| Customer Effort Score (CES) | Low-Medium - survey design needed | Low - survey deployment | Identifies friction points, predicts loyalty | Optimizing processes, reducing customer effort | Strong loyalty predictor, actionable insights |
| Customer Retention Rate | Medium - requires consistent tracking | Medium - data analytics | Long-term loyalty measurement, revenue impact | Overall customer base loyalty and business health | Direct link to profitability, supports planning |
| Average Handle Time (AHT) | Medium - call tracking and analytics | Medium - workforce management tools | Optimized staffing, cost control, efficiency metric | Contact centers focused on operational efficiency | Balances efficiency with quality, aids training |
| SLA Compliance | High - continuous monitoring and reporting | High - performance tracking systems | Accountability, service reliability, contractual compliance | Organizations with formal customer commitments | Builds trust and accountability, supports improvements |
Elevating Your Customer Service with FlowGent AI and KPIs
This in-depth exploration of eight key customer service performance indicators (KPIs) provides a robust framework for evaluating and enhancing your customer service operations. From understanding customer satisfaction (CSAT) and loyalty (NPS) to optimizing efficiency metrics like First Call Resolution (FCR) and Average Handle Time (AHT), these KPIs offer invaluable insights into the effectiveness of your customer service strategy. By actively monitoring and analyzing these metrics, businesses can identify areas for improvement, enhance customer experiences, and ultimately drive growth.
The Power of Data-Driven Decisions
The true value of these KPIs lies in their ability to inform data-driven decisions. Rather than relying on gut feelings, businesses can leverage concrete data to pinpoint specific areas of strength and weakness. This targeted approach allows for more effective resource allocation and strategic planning, leading to measurable improvements in customer satisfaction and operational efficiency.
Beyond Measurement: Driving Actionable Change
Understanding these customer service performance indicators is only the first step. The real power comes from translating these insights into actionable strategies. For instance, a low FCR might indicate a need for better agent training or improved knowledge base resources. Similarly, a declining CSAT score could signal issues with product quality or service delivery. By actively addressing these underlying issues, businesses can create a cycle of continuous improvement.
Optimizing for the Future with AI
In today's rapidly evolving digital landscape, staying ahead of the curve requires embracing innovative solutions. AI-powered platforms like FlowGent AI offer a transformative approach to customer service, enabling businesses to deliver personalized, efficient, and scalable support. By automating routine tasks, providing 24/7 availability, and offering multilingual support, FlowGent AI empowers businesses to meet the evolving needs of their customers.
Integrating AI and KPIs: A Synergistic Approach
The combination of robust KPIs and AI-powered solutions like FlowGent AI creates a powerful synergy. FlowGent AI can directly impact key customer service performance indicators by:
- Reducing Average Handle Time (AHT): AI-powered automation handles routine inquiries, freeing up human agents to focus on more complex issues.
- Improving First Call Resolution (FCR): AI provides agents with instant access to relevant information, empowering them to resolve customer issues quickly and efficiently.
- Boosting Customer Satisfaction (CSAT): Personalized and efficient interactions enhance the overall customer experience, leading to higher satisfaction scores.
- Increasing Customer Retention Rate: Proactive and seamless support builds stronger customer relationships, fostering loyalty and reducing churn.
Embracing a Customer-Centric Approach
Mastering these customer service performance indicators and leveraging the power of AI is not just about improving metrics; it's about building stronger customer relationships. By prioritizing customer needs and delivering exceptional experiences, businesses can cultivate loyalty, drive positive word-of-mouth referrals, and ultimately achieve sustainable growth. In the competitive landscape of 2025 and beyond, a customer-centric approach is no longer a luxury - it's a necessity.
Ready to transform your customer service and unlock the full potential of your business? Discover how FlowGent AI can help you optimize your customer service performance indicators and deliver exceptional customer experiences. Visit FlowGent AI to learn more.