


Why Your Business Needs More Than Just Good Service: A Guide to Data-Driven Support
In today's competitive landscape, delivering 'good' customer service isn't enough. The most successful companies understand that exceptional support is a science, driven by precise data and strategic insights. This is where customer service KPIs (Key Performance Indicators) become indispensable. These metrics transform abstract goals like "improving customer satisfaction" into measurable, actionable targets that directly impact your bottom line.
By tracking the right KPIs, you can pinpoint inefficiencies, optimize agent performance, and reduce operational costs. This data-driven approach is essential for building a loyal customer base that fuels sustainable growth. Achieving this requires a focus on efficient customer engagement through automation, which helps streamline interactions and frees up your team to handle more complex issues.
This guide will provide a comprehensive roundup of the 8 most critical customer service KPIs. We'll dive deep into what each metric means, how to calculate it, what industry benchmarks to aim for, and practical tips for implementation. Whether you're building a support team from scratch or refining an established operation, this is your blueprint for creating a data-driven customer service engine that delivers tangible business results.
Turn Instagram DMs into booked calls
AI that qualifies leads, handles objections, and follows up - so you don't have to.
1. Customer Satisfaction Score (CSAT)
Customer Satisfaction Score (CSAT) is one of the most direct and widely used customer service KPIs. It measures how satisfied a customer is with a specific interaction, service, or product. The metric is captured through a simple, pointed question, such as, "How would you rate your overall satisfaction with the service you received?" Customers typically respond on a numerical scale, often 1-5 or 1-10.
Its primary strength lies in its simplicity and immediacy. By deploying a CSAT survey immediately after a support ticket is closed, a purchase is completed, or a chat conversation ends, businesses can capture in-the-moment feedback. This allows teams to directly correlate customer sentiment with specific touchpoints and agent performance. For instance, an e-commerce brand like Zappos uses CSAT to ensure its legendary service remains above a 90% satisfaction rate, linking agent incentives to these scores.
How to Calculate and Implement CSAT
Calculating your CSAT score is straightforward. You divide the number of "satisfied" customers (those who rated you 4 or 5 on a 5-point scale) by the total number of survey responses, then multiply by 100 to get a percentage.
Formula: (Number of Satisfied Customers / Total Number of Survey Responses) x 100 = CSAT %
To implement CSAT effectively:
- Keep it short: Limit surveys to one or two questions to maximize response rates.
- Time it right: Send the survey immediately after the interaction to get the most accurate feedback.
- Follow up: Actively reach out to customers who leave low scores to understand their issues and demonstrate that you value their feedback. This can turn a negative experience into a positive one.
The following bar chart illustrates common benchmarks for CSAT scores, helping you gauge your performance against industry standards.
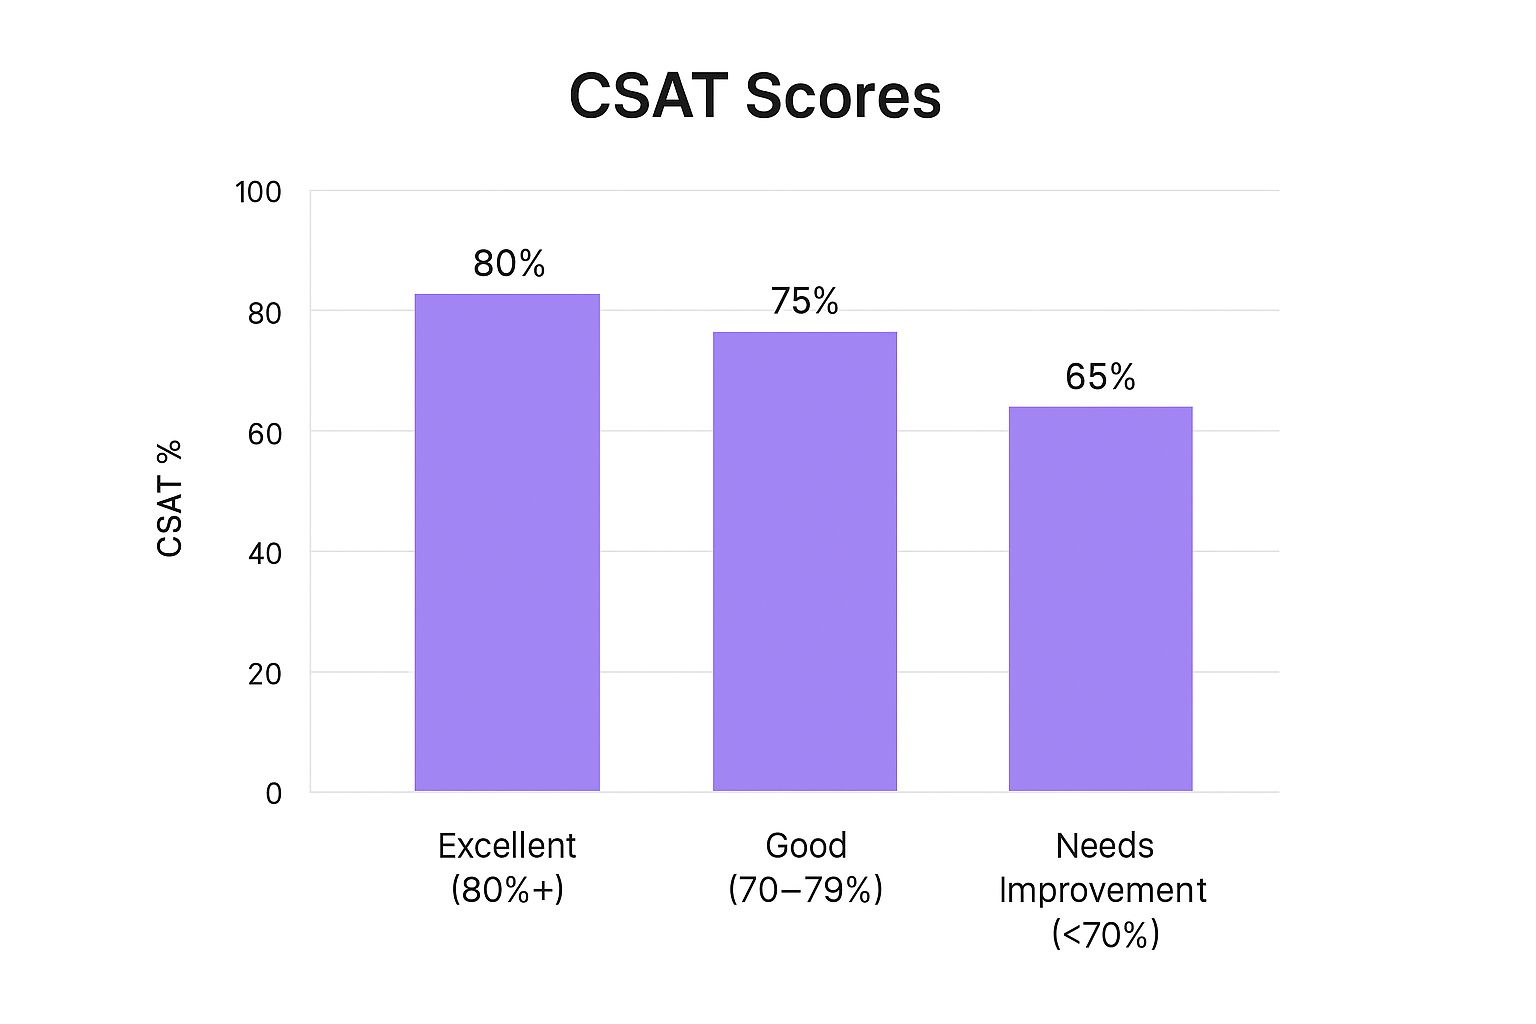
As the chart shows, a score above 80% is generally considered excellent, while scores below 70% indicate a clear need for improvement in your service delivery.
2. Net Promoter Score (NPS)
Net Promoter Score (NPS) is a widely adopted loyalty metric that measures the likelihood of customers recommending your company, product, or service to others. Popularized by Fred Reichheld of Bain & Company, it hinges on a single, powerful question: "On a scale of 0 to 10, how likely are you to recommend our business to a friend or colleague?" Based on their response, customers are segmented into three distinct categories: Promoters (9-10), Passives (7-8), and Detractors (0-6).
The power of NPS comes from its focus on customer loyalty, which is a strong predictor of long-term growth. It moves beyond transactional satisfaction to gauge overall brand sentiment. For instance, companies like Tesla and Southwest Airlines leverage their high NPS scores not just as a vanity metric, but as a leading indicator of market share and customer retention. Similarly, Netflix tracks NPS to guide content strategy and proactively predict potential subscriber churn, linking service perception directly to business outcomes.
How to Calculate and Implement NPS
Calculating your NPS score involves a simple subtraction. You take the percentage of customers who are Promoters and subtract the percentage who are Detractors. Passives are included in the total number of respondents but not directly in the final score calculation.
Formula: (Percentage of Promoters) - (Percentage of Detractors) = NPS Score
To implement NPS effectively:
- Ask "Why?": Always follow up the numerical question with an open-ended one, such as "What is the primary reason for your score?" This provides critical context behind the numbers.
- Track Trends: Focus on the movement of your NPS score over time rather than a single snapshot. This helps you understand the impact of your service improvements or business changes.
- Segment Your Data: Analyze NPS by customer journey stage, product line, or demographic. This reveals specific strengths and weaknesses within your business.
- Close the Loop: Create clear action plans to follow up with Detractors to resolve their issues and engage with Passives to understand what it would take to turn them into Promoters.
3. First Call Resolution (FCR)
First Call Resolution (FCR) is a critical efficiency metric that measures the percentage of customer issues resolved during the first contact, eliminating the need for follow-up calls or emails. It is one of the most vital customer service KPIs because it directly correlates with both customer satisfaction and operational efficiency. When an issue is solved quickly and on the first try, it reduces customer effort and frees up agent time, lowering overall service costs.

The power of FCR is evident in its real-world application. For example, Dell invested heavily in comprehensive agent training and resource accessibility, helping them achieve an 85% FCR rate. Similarly, American Express uses intelligent skill-based routing to direct customers to specialized agents, maintaining a consistent FCR above 80%. These examples prove that a high FCR is a hallmark of an effective and well-supported service team. A strong focus on FCR not only boosts satisfaction but also builds long-term customer loyalty.
How to Calculate and Implement FCR
Calculating your FCR rate is a simple division. You take the total number of support cases resolved on the first contact and divide it by the total number of cases received during the same period.
Formula: (Total Cases Resolved on First Contact / Total Number of Cases) x 100 = FCR %
To implement FCR successfully, focus on empowering your agents:
- Invest in training: Equip agents with deep product knowledge and problem-solving skills to handle a wide range of issues.
- Provide complete context: Give agents full access to a customer's history, including past purchases and support interactions, to avoid repetitive questions.
- Build a robust knowledge base: Create and maintain a detailed, easily searchable knowledge base and internal decision trees to guide agents to quick solutions.
- Implement intelligent routing: Use skill-based or issue-based routing to ensure customers are immediately connected with the agent best qualified to solve their problem.
While FCR is a powerful metric, it's important to set realistic targets that don't incentivize agents to rush or close tickets prematurely, which could harm service quality. For a deeper dive into how FCR fits into a broader strategy, you can explore other essential customer support metrics on flowgent.ai.
4. Average Handle Time (AHT)
Average Handle Time (AHT) is a fundamental operational metric among customer service KPIs. It measures the average duration of a customer interaction from start to finish, encompassing talk time, hold time, and any after-call work (ACW) an agent performs to resolve the issue. AHT is crucial for workforce planning, managing operational costs, and optimizing team efficiency. However, it's vital to balance AHT with quality metrics to ensure that the pursuit of speed doesn't compromise the customer experience.
The primary value of AHT is its direct link to operational efficiency and staffing levels. A lower AHT means agents can handle more interactions, which can reduce customer wait times and lower labor costs. For instance, a technical support center might aim for a 12-15 minute AHT for complex problems, while a retail call center could target a 4-6 minute AHT for order inquiries. Monitoring this KPI helps managers identify training needs, process bottlenecks, and opportunities for tool improvements.
How to Calculate and Implement AHT
Calculating AHT involves adding your total talk time, total hold time, and total after-call work time, then dividing by the total number of calls. The result is the average time spent on each interaction.
Formula: (Total Talk Time + Total Hold Time + Total After-Call Work) / Total Number of Interactions = AHT
To implement AHT effectively:
- Segment by interaction type: Calculate AHT separately for different query types (e.g., billing vs. technical support) to set realistic benchmarks.
- Equip your team: Provide agents with efficient tools, knowledge bases, and clear scripts to resolve issues faster. For example, implementing technologies for streamlining CRM note-taking with voice-to-text can significantly cut down after-call work.
- Focus on trends: Instead of scrutinizing individual call times, monitor AHT trends over time to identify systemic issues or improvements.
- Combine with quality scores: Always analyze AHT alongside CSAT or other quality metrics to ensure efficiency doesn't come at the cost of customer satisfaction. You can learn more about other customer service performance indicators to create a balanced scorecard.
5. Customer Effort Score (CES)
Customer Effort Score (CES) is a powerful customer experience metric that measures the ease of a customer's interaction with a company. Instead of gauging satisfaction, CES focuses on how much effort a customer had to expend to get a question answered, a problem solved, or a request fulfilled. The metric is captured by asking customers to rate their agreement with a statement like, "The company made it easy for me to handle my issue," typically on a 1-7 scale.
Popularized by research in the Harvard Business Review, CES is built on the principle that loyalty is driven more by reducing customer friction than by delighting them. High-effort experiences, like having to repeat information or switch channels, are strong predictors of disloyalty. For example, Amazon’s one-click ordering system is a masterclass in reducing customer effort, creating a seamless process that encourages repeat business. Similarly, Progressive Insurance streamlined its claims process specifically to lower CES, recognizing that a difficult claims experience is a major reason customers switch providers.
How to Calculate and Implement CES
Calculating CES involves finding the average of all responses. You sum up all the scores from your surveys and divide by the total number of responses.
Formula: (Sum of All CES Scores / Total Number of Survey Responses) = Average CES Score
To implement CES effectively and make it one of your core customer service KPIs:
- Focus on specific interactions: Ask for CES feedback immediately after key touchpoints like a support ticket resolution or using a self-service portal.
- Identify and eliminate pain points: Use high-effort scores (low ratings) to pinpoint and prioritize areas for process improvement, such as confusing website navigation or long hold times.
- Train agents to reduce effort: Empower support agents to resolve issues in the first contact and proactively guide customers to the fastest solution, rather than just following a script.
- Combine with journey mapping: Use CES data alongside customer journey maps to visualize exactly where friction occurs and design a more effortless experience from end to end.
6. Service Level Agreement (SLA) Compliance
Service Level Agreement (SLA) Compliance is a critical KPI that measures a customer service team's ability to meet predefined performance commitments. These agreements formalize expectations around key metrics like response times, resolution times, and service availability, acting as a contract between a business and its customers. Tracking SLA compliance is essential for maintaining customer trust, upholding contractual obligations, and ensuring a consistent and reliable service standard.
The power of this KPI lies in its ability to enforce accountability and manage customer expectations. For B2B companies, in particular, meeting SLAs is non-negotiable. For instance, a cloud provider like Microsoft Azure guarantees specific response times for different support tiers, and failing to meet these can result in penalties. Similarly, enterprise software companies like ServiceNow and Salesforce strive for near-perfect SLA compliance across their global customer base, as it directly impacts customer retention and brand reputation.
How to Calculate and Implement SLA Compliance
Calculating your SLA compliance rate is a measure of success versus commitment. You divide the number of tickets or interactions that met their SLA targets by the total number of tickets, then multiply by 100 to get a percentage.
Formula: (Number of Tickets Meeting SLA / Total Number of Tickets) x 100 = SLA Compliance %
To implement SLA compliance tracking effectively:
- Set realistic targets: Use historical performance data to establish achievable yet challenging SLA goals. Setting unattainable goals will only demotivate your team.
- Implement tiered SLAs: Not all issues are equal. Create different SLA targets based on issue priority or severity, such as a 1-hour response time for critical system failures versus a 24-hour response for general inquiries.
- Automate monitoring: Use help desk software to automatically track time against SLAs and send alerts to managers when an agreement is at risk of being breached. This allows for proactive intervention.
- Communicate transparently: Be open with customers about your SLA performance. This transparency builds trust, even when you occasionally miss a target.
7. Customer Churn Rate
Customer Churn Rate is a critical business metric that measures the percentage of customers who stop doing business with a company over a specific period. While it is often viewed as a high-level business KPI, it is deeply influenced by the quality of customer service. A high churn rate can be a direct symptom of poor service experiences, making it one of the most impactful customer service KPIs for gauging long-term health and the financial consequences of support quality.
The primary power of this metric is its direct link to revenue and growth. Unlike satisfaction scores, which measure sentiment, churn measures actual customer behavior and its financial impact. For instance, SaaS companies like Slack focus intensely on reducing churn by providing proactive, seamless support, knowing that even a small reduction in churn significantly boosts lifetime value. Similarly, telecommunications companies, which often face annual churn rates exceeding 20%, use service quality as a key differentiator to retain customers in a highly competitive market.
How to Calculate and Implement Churn Rate
Calculating your basic Customer Churn Rate is done by dividing the number of customers you lost during a specific period by the number of customers you had at the start of that period, then multiplying by 100.
Formula: (Customers Lost in Period / Customers at Start of Period) x 100 = Churn Rate %
To use churn rate effectively as a customer service KPI:
- Segment your analysis: Analyze churn based on customer service interaction history. Did customers who churned contact support frequently? Were their satisfaction scores low? This connects service performance directly to retention.
- Conduct exit interviews: Systematically ask departing customers why they are leaving. This qualitative data is invaluable for pinpointing specific service-related failures that need to be addressed.
- Implement early warnings: Use service metrics like low CSAT scores, high First Response Times, or multiple contacts for the same issue to flag at-risk customers before they decide to leave.
- Focus on retention programs: Use the insights gained to develop targeted customer retention strategies aimed at high-value customers who show signs of dissatisfaction. This proactive approach can significantly reduce churn.
8. Agent Utilization Rate
Agent Utilization Rate is a critical operational efficiency metric that measures the percentage of time agents spend on customer-related activities compared to their total available or logged-in time. These productive tasks include handling calls, responding to chats and emails, and completing necessary after-call work. This KPI is essential for workforce management, helping leaders optimize staffing levels, control costs, and ensure service coverage without overworking their teams.
The primary value of this metric lies in its ability to balance productivity with sustainability. While high utilization can indicate an efficient team, setting targets too high can lead to agent burnout and a drop in service quality. For example, a high-volume call center might aim for a 75-85% utilization rate to maximize efficiency, whereas a technical support team dealing with complex issues may target a lower 70-80% rate to allow for more in-depth problem-solving and research. Analyzing this among your other customer service KPIs gives a full picture of operational health.
How to Calculate and Implement Agent Utilization Rate
Calculating Agent Utilization Rate involves dividing an agent's total productive time by their total available time and expressing it as a percentage.
Formula: (Total Productive Time / Total Available Time) x 100 = Agent Utilization Rate %
To implement this KPI effectively:
- Balance with Quality: Always monitor utilization alongside quality assurance and customer satisfaction scores. High utilization should never come at the expense of excellent service.
- Set Realistic Targets: Establish different utilization benchmarks for different channels or teams. Chat agents who can multitask may achieve over 90% utilization, which would be unsustainable for voice agents.
- Factor in All Work: Ensure your calculation of "productive time" includes essential tasks like after-call work, case documentation, and follow-ups, not just direct customer interaction time.
- Promote Agent Well-being: Use utilization data to inform scheduling, ensuring agents have adequate time for breaks, coaching, and training to prevent burnout and maintain high performance.
Customer Service KPI Comparison Guide
| Metric | Implementation Complexity 🔄 | Resource Requirements ⚡ | Expected Outcomes 📊 | Ideal Use Cases 💡 | Key Advantages ⭐ |
|---|---|---|---|---|---|
| Customer Satisfaction Score (CSAT) | Low – Simple surveys, easy CRM integration | Low – Minimal tools, automated triggers | Immediate feedback on satisfaction, actionable insights | Post-interaction quality checks, service feedback | Easy to implement, high response rate, real-time data |
| Net Promoter Score (NPS) | Low – Single question, standard scoring | Low – Survey platforms, longitudinal tracking | Loyalty indication, growth prediction | Brand loyalty, advocacy tracking | Strong growth correlation, standardized benchmarking |
| First Call Resolution (FCR) | Medium – Requires robust tracking, multi-channel | Medium to High – Case tracking systems needed | Improved satisfaction, cost reduction, operational efficiency | Customer service centers focusing on resolution | Direct impact on satisfaction and operational cost |
| Average Handle Time (AHT) | Medium – Data collection across multiple time types | Medium – Call monitoring, workforce management | Workforce planning, cost management, efficiency insights | Staffing, process optimization | Essential for productivity planning and cost control |
| Customer Effort Score (CES) | Low to Medium – Specialized survey design | Low – Survey tools, focused question design | Identifies friction points, loyalty prediction | Process improvement, reducing customer effort | Strong loyalty predictor, actionable process insights |
| SLA Compliance | Medium to High – Monitoring & alerting systems | Medium to High – Integration with service systems | Accountability, service consistency, trust building | Contractual service levels, premium support tiers | Clear expectations, proactive resource planning |
| Customer Churn Rate | Medium – Requires customer data tracking | Medium – Data analytics, segmentation | Retention insight, revenue forecasting | Long-term customer retention strategies | Direct business impact measurement, risk identification |
| Agent Utilization Rate | Medium – Time tracking and WFM integration | Medium – Workforce management systems | Optimized staffing, balanced workload | Workforce optimization and efficiency management | Cost control, capacity planning, resource allocation |
From Metrics to Momentum: Turning KPIs into Your Competitive Advantage
We’ve explored a comprehensive suite of eight essential customer service KPIs, from the customer-centric insights of CSAT and NPS to the operational precision of FCR and AHT. Each metric offers a unique lens through which to view your support performance. However, the true power of these key performance indicators is not found in isolation but in their synthesis. Tracking KPIs is not the end goal; it is the starting point for strategic action and continuous improvement.
Think of these metrics as interconnected signals. A declining Net Promoter Score might be the first symptom, but a high Customer Effort Score (CES) and a low First Call Resolution (FCR) rate are likely the underlying causes. Similarly, a high Average Handle Time (AHT) isn’t inherently negative if it correlates with a high CSAT score, indicating that agents are taking the necessary time to solve complex problems thoroughly and leave customers satisfied. The goal is to move beyond simply reporting numbers and start interpreting the stories they tell about your customer journey and internal processes.
From Data to Actionable Insights
Transforming raw data into meaningful change requires a strategic, focused approach. Avoid the common pitfall of "analysis paralysis" by implementing a clear plan:
- Start Small and Scale: Don’t try to implement all eight KPIs at once. Select two or three that align directly with your most pressing business objectives. If customer retention is your top priority, begin with Customer Churn Rate and NPS. If operational efficiency is the focus, start with AHT and Agent Utilization Rate.
- Establish Your Baseline: Once you've selected your initial KPIs, track them consistently for a set period to establish a baseline. This benchmark is crucial, as it provides the context needed to measure the impact of any changes you make, whether it's new agent training, a process refinement, or the adoption of new technology.
- Empower Your Team: Share these insights with your customer service agents. When your team understands the "why" behind the metrics, they become active participants in improving them. Frame KPIs not as punitive measures but as tools for professional growth and collective success. To truly leverage your KPIs, it's essential to understand how to apply and analyze these insights. Learn how to master communication metrics to connect your team's performance with broader business outcomes.
The Future is a Blend of Human and AI Excellence
The journey to exceptional customer service is continuous and dynamic. By mastering these customer service KPIs, you create a feedback loop that fuels growth, enhances customer loyalty, and builds a resilient brand. You transform your support center from a reactive cost center into a proactive engine for value creation and a powerful competitive advantage in a crowded marketplace. This data-driven approach ensures that every decision you make is informed, intentional, and geared toward delivering the outstanding experience your customers deserve.
Ready to elevate your customer support and see a direct impact on your key metrics? FlowGent AI automates routine inquiries, freeing your team to focus on high-value interactions that boost CSAT and FCR. Discover how our intelligent AI agents can help you improve response times and drive your customer service KPIs to new heights.