


Elevate Your Customer Service with the Right KPIs
Want to deliver outstanding customer service and boost your bottom line? Tracking the right key performance indicators (KPIs) is essential. This listicle covers eight crucial customer service KPIs, including Customer Satisfaction Score (customer satisfaction score calculation), Net Promoter Score (NPS), First Contact Resolution (FCR), Average Resolution Time, Customer Effort Score (CES), Customer Churn Rate, Average Handle Time (AHT), and Customer Retention Rate. Learn what each KPI means, how to calculate it, and how to use it to improve your customer service strategy. This knowledge empowers you to identify areas for improvement, track progress, and enhance customer loyalty.
Turn Instagram DMs into booked calls
AI that qualifies leads, handles objections, and follows up - so you don't have to.
1. Customer Satisfaction Score (CSAT)
Customer Satisfaction Score (CSAT) is a key performance indicator (KPI) for customer service that measures how satisfied customers are with a specific interaction, product, or service. It's a crucial metric for businesses seeking to understand and improve their customer experience. Typically, CSAT involves asking customers to rate their satisfaction on a numerical scale, often 1-5 or 1-10, immediately after an interaction. These individual ratings are then aggregated to calculate a percentage score, providing a snapshot of customer sentiment. CSAT offers immediate feedback, making it one of the most widely used metrics for evaluating customer service quality and identifying areas for improvement. This makes it an essential KPI for businesses of all sizes, from small e-commerce retailers to global enterprises.
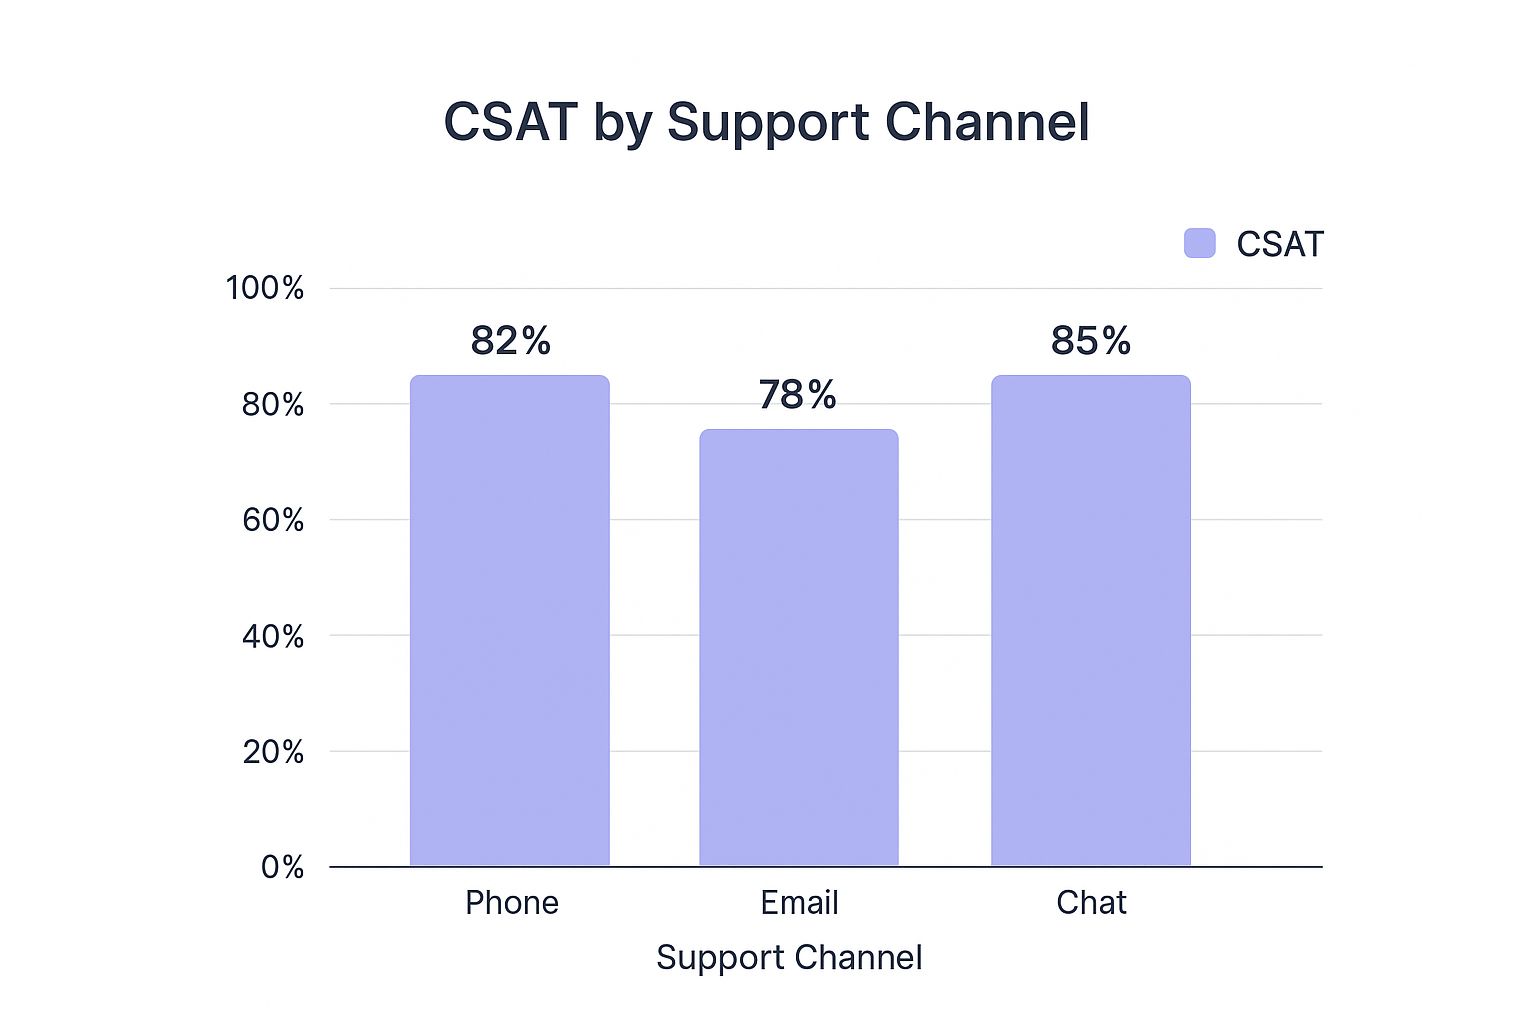
The infographic above visually represents data from a survey regarding customer satisfaction with support interactions. It demonstrates the correlation between different CSAT scores (1-5) and the likelihood of customers repurchasing or recommending the brand. As the chart clearly shows, higher CSAT scores correlate directly with higher customer retention and positive word-of-mouth referrals. This emphasizes the importance of striving for high CSAT scores to drive business growth.
CSAT is usually measured using a 1-5 or 1-10 scale, often calculating the percentage of positive responses (e.g., 4-5 on a 5-point scale). It can be measured after specific interactions like a support call, live chat session, or purchase, or periodically to gauge overall satisfaction. The key feature of CSAT is its ability to provide direct feedback on specific customer experiences. This immediacy allows businesses to address issues promptly and proactively enhance their service.
Pros:
- Simple to implement and understand: Easy to integrate into existing systems and interpret results.
- Provides immediate, actionable feedback: Allows for rapid response to negative experiences and quick identification of service gaps.
- Can be targeted to specific touchpoints: Pinpoints areas within the customer journey that require attention.
- High response rates compared to other surveys: Short and focused nature encourages participation.
- Easily benchmarked across industry standards: Provides context for performance and identifies areas for improvement.
Cons:
- Subject to response bias: Extremely satisfied or dissatisfied customers are more likely to respond.
- Point-in-time measurement: Doesn't always reflect the overall customer relationship.
- Cultural differences can impact how people rate satisfaction: Interpreting scores may require cultural context.
- May not correlate strongly with customer loyalty or retention: While a good indicator, CSAT alone doesn't guarantee loyalty.
Examples of Successful Implementation:
- Amazon: Sends CSAT surveys after each customer service interaction to gauge immediate feedback on agent performance.
- Zappos: Measures CSAT across multiple touchpoints and maintains impressively high scores, reflecting their commitment to customer service.
- Apple Store: Tracks CSAT for both in-store service and Genius Bar appointments to optimize both aspects of the customer experience.
Tips for Effective CSAT Implementation:
- Keep surveys short and focused on specific interactions.
- Ask for CSAT ratings immediately after service interactions.
- Segment CSAT scores by customer type, issue type, and agent.
- Follow up on negative scores quickly to resolve issues and improve customer relationships.
- Combine with qualitative feedback for deeper context and actionable insights.
CSAT deserves its place in the list of key performance indicators for customer service because it provides a direct line to understanding customer sentiment regarding specific interactions. This immediate feedback allows businesses to address issues quickly, improve their service delivery, and enhance the overall customer experience. Learn more about Customer Satisfaction Score (CSAT) For businesses focused on scalable support, optimized e-commerce experiences, and automated customer service, tracking CSAT is essential. This is particularly relevant for digital agencies offering AI-driven support solutions and global enterprises requiring multilingual engagement, as it provides a consistent metric for measuring customer satisfaction across various channels and languages. Leveraging platforms like Salesforce Service Cloud and Zendesk Benchmark, which have popularized CSAT, allows businesses to streamline data collection and analysis for more efficient customer service management.
2. Net Promoter Score (NPS)
Net Promoter Score (NPS) is a key performance indicator (KPI) for customer service that gauges customer loyalty and their willingness to recommend your business. It's a powerful metric for understanding customer sentiment and predicting business growth. As a key performance indicator for customer service, NPS provides a valuable snapshot of overall customer satisfaction and loyalty, allowing businesses to identify areas for improvement and track the impact of customer service initiatives.
NPS revolves around a single, straightforward question: "How likely are you to recommend our company to a friend or colleague?" Customers respond on a scale of 0-10, and based on their answers, they fall into three categories:
- Promoters (9-10): These are your loyal enthusiasts, likely to drive positive word-of-mouth and repeat business.
- Passives (7-8): Satisfied but not necessarily enthusiastic, these customers are susceptible to competitive offerings.
- Detractors (0-6): Unhappy customers who may churn and potentially damage your brand reputation through negative feedback.
Your NPS is calculated by subtracting the percentage of Detractors from the percentage of Promoters, resulting in a score between -100 and +100. For example, if you survey 100 customers and have 70 Promoters, 20 Passives, and 10 Detractors, your NPS would be 70% - 10% = 60.
Why NPS Deserves Its Place in the List: Its simplicity, combined with its strong correlation to business growth, makes NPS an invaluable metric. It provides a high-level view of customer sentiment, facilitates benchmarking, and allows for targeted interventions to improve customer relationships.
Features and Benefits:
- Single question methodology: Easy to implement and understand, minimizing survey fatigue.
- Clear categorization: Provides insights into the distribution of customer sentiment.
- Quantifiable score: Allows for tracking progress and benchmarking against competitors.
- Actionable insights: When combined with follow-up questions, NPS helps pinpoint specific areas for improvement.
Pros:
- Simple, easy to implement and understand.
- Strong correlation with business growth and customer loyalty.
- Benchmarkable across industries.
- Identifies both advocates and at-risk customers.
- Widely adopted, allowing for meaningful comparisons.
Cons:
- Single metric may oversimplify complex customer relationships.
- Cultural variations can impact scoring tendencies.
- Doesn't inherently identify specific improvement areas without additional questions.
- Can be manipulated if tied directly to compensation.
- May not capture the full range of customer emotions.
Examples of Successful Implementation:
- Apple consistently maintains NPS scores above 70.
- USAA (financial services) reports NPS scores of 80+.
- Discover Card improved its NPS from 56 to 73 through targeted customer service improvements.
- Slack maintains an NPS of approximately 40-45, well above the software industry average.
Actionable Tips:
- Combine NPS with "Why did you give this score?" follow-up questions: This provides valuable qualitative data to understand the drivers behind the scores.
- Measure at both relationship level (overall brand) and transactional level (specific interactions): This allows you to pinpoint areas for improvement within the customer journey.
- Close the loop with detractors to address concerns: Turning negative experiences into positive ones can significantly impact your NPS.
- Leverage promoters for referrals and testimonials: Encourage your loyal customers to spread the word.
- Focus on moving passive customers to promoters: Identify what it takes to turn satisfied customers into enthusiastic advocates.
When and Why to Use NPS:
NPS is particularly relevant for businesses focused on customer-centric growth. It's an effective tool for:
- Tracking customer loyalty over time.
- Benchmarking against competitors.
- Identifying areas for improvement in customer service.
- Measuring the impact of customer experience initiatives.
By consistently monitoring and acting upon your NPS data, you can cultivate stronger customer relationships, drive positive word-of-mouth referrals, and ultimately fuel business growth.
3. First Contact Resolution (FCR)
First Contact Resolution (FCR) is a key performance indicator for customer service that measures the percentage of customer inquiries or issues resolved during the initial interaction, without the need for follow-up contacts or escalations. It's a critical metric for both efficiency and effectiveness, directly impacting customer satisfaction. Customers overwhelmingly prefer having their issues resolved quickly and efficiently in a single interaction, rather than having to endure multiple contacts, explanations, and wait times. A high FCR demonstrates a company's ability to effectively address customer needs the first time around, leading to improved customer loyalty and reduced operational costs.

FCR tracks resolution across various communication channels, including phone calls, live chat, email, and social media. It is typically expressed as a percentage and can be measured through post-interaction surveys or internal tracking systems. To gain deeper insights, FCR data is often segmented by channel, issue type, and even individual agent performance. This granular analysis helps pinpoint areas for improvement and identify best practices. FCR directly correlates with customer effort and satisfaction, making it a valuable metric for understanding the overall customer experience.
Features and Benefits:
- Tracks resolution across multiple channels (call, chat, email, etc.)
- Expressed as a percentage for easy benchmarking.
- Measurable through surveys and internal tracking.
- Segmentable by channel, issue type, and agent.
- Directly correlated with customer effort and satisfaction.
- Reduces operational costs and improves agent productivity.
Pros:
- Strong correlation with customer satisfaction and loyalty.
- Reduces operational costs by minimizing repeat contacts.
- Improves agent productivity and efficiency.
- Identifies training opportunities and areas for process improvement.
- Enhances customer experience by reducing effort.
Cons:
- May incentivize incomplete resolutions to artificially inflate targets.
- The definition of 'resolved' can be subjective and inconsistent across teams.
- Some complex issues legitimately require multiple contacts, regardless of agent skill.
- Accurately tracking FCR across multiple channels can be challenging.
- May conflict with average handle time targets, potentially leading to rushed resolutions.
Examples of Successful Implementation:
- TD Bank increased FCR by 12% by investing in improved agent training and enhancing their knowledge base accessibility.
- Comcast implemented AI-powered knowledge bases, boosting FCR from 67% to 82% and significantly improving customer satisfaction.
- American Express maintains impressively high FCR rates above 90% for card member services, setting a benchmark for the industry.
Tips for Improving FCR:
- Define "resolution" clearly and consistently across all teams to ensure accurate tracking and avoid discrepancies.
- Develop comprehensive knowledge bases readily accessible to agents, empowering them to quickly find solutions to common customer issues.
- Implement skills-based routing to connect customers with the most qualified agent for their specific issue, increasing the likelihood of first-contact resolution.
- Empower frontline agents with greater authority to resolve issues independently, minimizing escalations and delays.
- Regularly review low FCR cases to identify systematic problems and implement improvements in processes or training.
- Strive for balance between FCR and other key metrics like handle time and quality to ensure a holistic approach to customer service excellence.
FCR deserves its place in the list of key performance indicators for customer service because it provides a direct measure of how efficiently and effectively a company addresses customer needs. This metric is especially relevant for businesses aiming to provide seamless and satisfactory customer experiences.
Popularized By: Service Quality Measurement Group (SQM), International Customer Management Institute (ICMI), Amazon Customer Service, Zappos
This KPI is crucial for small to medium-sized businesses, e-commerce retailers, customer service teams, digital agencies, and global enterprises alike, as it directly translates to happier customers, reduced costs, and improved operational efficiency. By focusing on FCR, businesses can build stronger customer relationships and gain a competitive advantage in today's demanding market.
4. Average Resolution Time
Average Resolution Time (ART) is a key performance indicator (KPI) for customer service that measures the average time taken to completely resolve a customer issue or request, from the initial contact to the final resolution. It's a crucial metric for understanding how efficiently your team handles customer issues and provides a comprehensive view of the customer's end-to-end experience. Unlike Average Handle Time (AHT), which focuses solely on the duration of individual interactions, ART encompasses the entire resolution process, including any follow-up interactions, research time, escalations, and back-and-forth communication required to achieve a full resolution. This provides a more accurate picture of service efficiency and customer effort.
This KPI deserves its place on the list of key performance indicators for customer service because it offers a customer-centric perspective. While speed is important, ultimately, customers care most about getting their issues resolved fully and efficiently. ART directly reflects this outcome.
How it Works:
ART is typically measured in hours or days. It's calculated by summing the total time taken to resolve all issues within a specific timeframe and then dividing by the number of resolved issues. This can be tracked manually or, more efficiently, through customer service platforms and helpdesk software.
Features and Benefits:
- Measures total elapsed time: Captures the complete customer journey from problem initiation to final resolution.
- Comprehensive view: Includes all interactions, research, and escalations related to a specific issue.
- Segmentable: Can be analyzed by issue type, complexity, channel (e.g., phone, email, chat), and team, offering granular insights.
- Reflects both efficiency and effectiveness: Measures not just speed but also the quality of the resolution.
Pros:
- Customer-centric focus: Provides insights into the customer's overall experience with the resolution process.
- Bottleneck identification: Helps pinpoint areas where complex resolutions are getting stuck.
- Realistic expectations: Allows for setting accurate customer expectations regarding resolution times.
- Correlation with satisfaction: Directly links to customer effort and satisfaction scores.
- Process improvement: Highlights opportunities to streamline workflows and improve service delivery.
Cons:
- Skewed by outliers: Complex or unusual cases can disproportionately inflate the average.
- Potential for rushed resolutions: Focusing solely on improving ART can lead to agents rushing resolutions, potentially sacrificing quality.
- Varying resolution times: Different issue types naturally have different resolution timelines.
- Tracking complexity: Requires robust tracking systems to capture all interactions across multiple channels.
- External factors: Customer-caused delays (e.g., delayed responses) can artificially inflate ART.
Examples of Successful Implementation:
- HubSpot reduced their average resolution time from 24 hours to 6 hours by improving ticket routing and agent specialization, demonstrating the impact of optimized workflows.
- Verizon implemented predictive service tools and cut resolution time by 35%, showcasing the power of technology in enhancing efficiency.
- Shopify maintains an average resolution time under 4 hours for technical support issues, setting a benchmark for responsiveness in the e-commerce sector.
Actionable Tips for Improvement:
- Segment your data: Analyze ART by issue type and complexity for meaningful benchmarking and targeted improvements.
- Tiered service levels: Establish different service level agreements (SLAs) with appropriate resolution time targets based on issue priority.
- Workflow automation: Automate routine tasks, such as ticket routing and notifications, to free up agent time for complex issues.
- Optimize escalations: Streamline escalation processes to eliminate unnecessary delays and ensure swift resolution of complex cases.
- Knowledge base creation: Develop comprehensive knowledge bases and FAQs to empower agents with quick access to information.
- Internal SLAs: Set clear internal SLAs for each stage of the resolution process to drive accountability and efficiency.
Learn more about Average Resolution Time
By diligently tracking and analyzing ART, businesses, particularly small and medium-sized businesses, e-commerce retailers, customer service teams, digital agencies, and global enterprises, can significantly enhance their customer service operations, reduce customer effort, and ultimately boost customer satisfaction. This KPI is crucial for those seeking scalable 24/7 support, improved order management, automated inquiries, cost reduction, and multilingual customer engagement. Using ART effectively empowers businesses to optimize their support processes and deliver exceptional customer experiences. This is why it's a vital key performance indicator for any customer-focused organization. ART’s inclusion in benchmark reports by Zendesk, Gartner, ServiceNow, and Freshworks underscores its importance in the industry.
5. Customer Effort Score (CES)
Customer Effort Score (CES) is a key performance indicator for customer service that measures how much effort a customer has to expend to get their issue resolved, a question answered, or complete a specific task. It's predicated on the idea that reducing customer effort is a more powerful driver of loyalty than exceeding expectations or "delighting" them. CES surveys typically ask customers to rate the ease of their experience on a numerical scale (usually 1-7), with lower scores indicating less effort and, consequently, a higher likelihood of retention and future purchases. This makes it a crucial metric for businesses striving to optimize their customer service operations and improve overall customer experience.
CES is usually measured on a scale of 1-7 (from "Very Difficult" to "Very Easy") and often phrased as "How easy was it to get your issue resolved?" Newer implementations sometimes use agreement scales with statements like "The company made it easy to handle my issue." This metric can be deployed after specific interactions (e.g., following a phone call with support) or to gauge the overall customer relationship. Unlike some other customer service KPIs, CES focuses on smoothing out friction points and streamlining processes rather than solely aiming for exceptional, positive experiences.
Why CES Deserves its Place in the List of Key Performance Indicators:
For businesses focused on building long-term customer relationships and driving repeat business, CES is indispensable. It offers a direct line of sight into operational efficiency and highlights areas for improvement within the customer journey. Unlike more general satisfaction metrics, CES pinpoints specific friction points, providing actionable insights for optimizing processes and reducing customer churn. It is particularly relevant in today's fast-paced digital environment where customers value speed and efficiency.
Features and Benefits:
- Strong predictor of loyalty: Research shows that reducing customer effort is a stronger indicator of loyalty than delight.
- Identifies friction points: CES helps pinpoint specific areas where customers struggle, enabling targeted improvements.
- Actionable insights: More directly actionable than satisfaction or Net Promoter Score (NPS) alone, facilitating operational changes.
- Focus on efficiency: Emphasizes streamlining processes and minimizing hurdles in the customer journey.
Pros and Cons:
- Pros: Strong predictor of customer loyalty and repeat business, identifies specific friction points, more actionable than satisfaction or NPS alone, supported by research, directly ties to operational improvements.
- Cons: Relatively newer metric with less historical benchmarking data, may miss opportunities for creating memorable positive experiences, various scoring scales make cross-company comparisons difficult, can be challenging to attribute effort to specific touchpoints in complex journeys, perception of effort is subjective and context-dependent.
Examples of Successful Implementation:
- USAA leveraged predictive analytics to anticipate customer needs, proactively reducing effort.
- Amazon's 1-Click ordering exemplifies effort reduction driving loyalty.
- Intuit TurboTax improved CES by 10% through UX improvements and guided troubleshooting.
- T-Mobile improved their CES from 3.8 to 5.4 (on a 7-point scale) by redesigning their IVR system.
Tips for Implementing and Utilizing CES:
- Focus on friction points: Prioritize identifying and eliminating common sources of customer effort.
- Map the customer journey: Visualize the entire customer experience to pinpoint high-effort touchpoints.
- Gather qualitative feedback: Combine CES with qualitative data to understand why customers perceive high effort.
- Cross-channel measurement: Measure CES across different channels (phone, email, chat, etc.) and compare results.
- Monitor channel switching: Frequent channel switching by customers can indicate high effort in a specific channel.
- Empower agents: Equip customer service representatives with the authority to resolve issues without transfers or escalations.
Popularized By: Matthew Dixon, Karen Freeman, Nicholas Toman, Corporate Executive Board (CEB, now Gartner), The Effortless Experience.
This approach is particularly valuable for small and medium-sized businesses seeking scalable, 24/7 customer support; e-commerce retailers aiming to improve order management and response times; customer service teams looking to automate repetitive inquiries and reduce costs; digital agencies offering AI-driven support solutions; and global enterprises requiring multilingual, round-the-clock customer engagement. By focusing on minimizing customer effort, these organizations can improve customer loyalty, reduce churn, and drive sustainable growth.
6. Customer Churn Rate
Customer Churn Rate, a crucial key performance indicator for customer service, measures the percentage of customers who discontinue using a company's products or services within a specific timeframe. It serves as a powerful indicator of the overall health of your customer relationships and the effectiveness of your customer service strategies. In essence, it reflects the cumulative impact of service quality, issue resolution speed, and the overall customer experience. Reducing churn through improved customer service is typically more cost-effective than acquiring new customers, making it a vital metric for businesses of all sizes.
How it Works:
Churn rate is calculated by dividing the number of customers lost during a specific period by the total number of customers at the beginning of that period. This can be measured monthly, quarterly, or annually. It can also be calculated based on customer count or revenue value, providing different perspectives on the impact of churn. Furthermore, segmenting churn rate by customer tenure, size, and value allows businesses to pinpoint specific areas for improvement and tailor retention strategies accordingly. For example, you might find that high-value customers with longer tenure are churning at a higher rate than others, signaling a potential problem with your service delivery for this key segment.
Why Customer Churn Rate Matters:
Customer Churn Rate deserves its place on the list of key performance indicators for customer service because it directly impacts company financials and growth. High churn rates can significantly hinder revenue and profitability. By closely monitoring and actively working to reduce churn, businesses can protect their revenue streams and allocate resources more effectively. Moreover, understanding churn drivers allows companies to proactively address customer pain points, ultimately leading to increased customer satisfaction and loyalty.
Features and Benefits:
- Clear Financial Impact: Provides a quantifiable measure of the financial implications of customer service quality.
- Value of Service Improvements: Helps demonstrate the return on investment (ROI) of initiatives aimed at enhancing customer service.
- Identification of At-Risk Customers: Highlights specific customer segments that are most likely to churn, allowing for targeted interventions.
- Alignment between Service and Business Outcomes: Creates a direct link between customer service performance and overall business goals.
- Predictive Modeling: Enables the development of predictive models to assess the impact of service interactions on customer retention.
Pros and Cons:
Pros:
- Provides a clear financial impact of customer service quality
- Helps quantify the value of service improvements
- Highlights at-risk customer segments
- Creates alignment between service teams and business outcomes
- Enables predictive modeling of service impact on retention
Cons:
- Lagging indicator that doesn't show immediate service impacts
- Influenced by many factors beyond customer service (pricing, competition, etc.)
- Different definitions across organizations make benchmarking difficult
- May overemphasize retention of all customers equally
- Can be difficult to attribute to specific service interactions
Examples of Successful Implementation:
- Netflix: Reduced churn by 2% through service improvements including personalized content recommendations and proactive communication about service outages.
- Comcast: Implemented a specialized retention team that reduced churn by 15% through improved service recovery.
- Spotify: Decreased premium subscriber churn from 5.7% to 4.8% by enhancing their customer support capabilities.
Actionable Tips:
- Segment Your Analysis: Analyze churn by customer value, tenure, and service interaction history to identify specific trends and patterns.
- Understand Why Customers Leave: Conduct churn reason analysis through exit surveys and customer feedback to uncover the root causes of churn.
- Predict and Prevent Churn: Implement predictive churn models based on service interactions and customer behavior to proactively address potential churn risks.
- Prioritize High-Value Customers: Create specialized retention processes and offer personalized support to high-value customers.
- Win Back Lost Customers: Use service recovery strategies and targeted outreach programs to win back recently churned customers.
- Correlate with Other Metrics: Correlate churn with other key performance indicators for customer service, such as Customer Satisfaction (CSAT) and First Contact Resolution (FCR), to identify predictive relationships and areas for improvement.
By focusing on Customer Churn Rate as a key performance indicator, businesses can gain valuable insights into customer behavior, improve service quality, and ultimately drive sustainable growth.
7. Average Handle Time (AHT)
Average Handle Time (AHT) is a key performance indicator for customer service that measures the average duration of a customer interaction from start to finish. This includes talk time, hold time, and any after-call work required to fully resolve the customer's issue. While AHT has traditionally been used to manage contact center costs and drive efficiency, modern customer service strategies recognize that simply minimizing AHT can negatively impact customer satisfaction. Instead, the focus should be on optimizing for appropriate handle times, acknowledging that complex issues may require longer conversations. This is crucial for businesses aiming to deliver exceptional customer experiences and build long-term loyalty.
This metric deserves a place on this list of key performance indicators for customer service because it offers valuable insights into operational efficiency and can pinpoint areas for improvement. It’s especially relevant for small and medium-sized businesses scaling their support operations, e-commerce retailers focused on quick response times, and global enterprises managing multilingual, 24/7 customer engagement. By understanding and effectively managing AHT, businesses can improve both customer satisfaction and operational efficiency.
Features of AHT:
- Typically measured in seconds or minutes.
- Encompasses total conversation time, hold time, and after-call work.
- Can be segmented by issue type, channel (e.g., phone, email, chat), agent, and customer segment.
- Directly impacts staffing requirements and operational costs.
- Varies significantly by industry and the complexity of customer issues.
Pros of Monitoring AHT:
- Clear Indicator of Operational Efficiency: Provides a quantifiable measure of how efficiently customer interactions are handled.
- Forecasting and Capacity Planning: Helps predict staffing needs and optimize resource allocation.
- Process Improvement: Identifies bottlenecks and opportunities to streamline workflows.
- Training Needs Identification: Comparing AHT across agents can highlight areas where additional training or coaching might be beneficial.
- Cost-Per-Contact Calculations: Enables accurate calculation of the cost associated with each customer interaction.
Cons of Overemphasizing AHT:
- Rushed Service and Poor Quality: Focusing solely on reducing AHT can incentivize agents to rush interactions, leading to unresolved issues and dissatisfied customers.
- Variability of Issue Complexity: Not all issues are created equal. Complex problems inherently require longer handle times.
- Conflict with First-Contact Resolution (FCR): Pressure to minimize AHT can conflict with achieving FCR, as agents may prioritize speed over thorough resolution.
- Disincentivizes Problem-Solving: Agents may avoid tackling complex issues to keep their AHT low.
- Impact on Customer Satisfaction: For complex issues, longer interactions may be necessary to ensure customer satisfaction and build rapport.
Examples of Successful AHT Implementation:
- Zappos: Famously does not measure AHT, prioritizing exceptional customer service and allowing agents to spend as much time as needed with each customer. Their longest call is reportedly over 10 hours!
- American Express: Uses AHT as a diagnostic tool rather than a performance metric, focusing on "appropriate handle time" based on the complexity of the issue.
- T-Mobile: Reduced AHT by 20% by implementing AI-assisted agent tools, which streamlined workflows and improved customer satisfaction (CSAT) simultaneously.
Actionable Tips for Optimizing AHT:
- Set Differentiated Targets: Establish different AHT targets for various types of inquiries, reflecting their complexity.
- Focus on Process Improvements: Reduce handle time by streamlining workflows and eliminating unnecessary steps, not by pressuring agents to work faster.
- Analyze AHT Distributions: Use AHT distributions rather than averages to identify outliers and pinpoint specific areas for improvement.
- Balance AHT with Quality Metrics: Don't focus on AHT in isolation. Balance it with quality metrics like FCR and CSAT to ensure a holistic approach to customer service.
- Implement Agent Desktop Tools: Provide agents with tools that reduce research and documentation time, such as knowledge bases and CRM integrations.
- Analyze Hold Time Separately: Identify specific opportunities to reduce hold time, such as improved call routing or addressing staffing shortages.
By following these tips and focusing on appropriate handle times, businesses can leverage AHT as a valuable tool for optimizing customer service operations, improving efficiency, and enhancing the overall customer experience.
8. Customer Retention Rate
Customer Retention Rate is a key performance indicator (KPI) for customer service that measures the percentage of customers a company retains over a specific period. Unlike churn rate, which focuses on customer loss, retention rate highlights a company's ability to cultivate lasting customer relationships. This KPI deserves a place on this list because it provides a crucial perspective on the long-term impact of customer service quality, connecting directly to revenue stability and predictability.
In the context of customer service, retention rate reflects the cumulative effect of positive service experiences. Satisfied customers are more likely to continue doing business with you. This is particularly valuable because retained customers often become more profitable over time, requiring less service investment as they become familiar with your products or services.
How it Works:
Customer Retention Rate is typically calculated monthly, quarterly, or annually. It can be measured based on several factors, including active usage of a product or service, subscription renewals, or repeat purchases. To gain deeper insights, it's often segmented by customer tenure (how long they've been a customer), value tier (how much they spend), and acquisition channel (how they initially became a customer). This allows businesses to identify which customer segments are most loyal and which require more attention. Retention rate directly correlates with customer lifetime value, a crucial metric for understanding long-term profitability. Importantly, it can also be linked back to specific service interactions and recovery efforts, revealing the direct impact of customer service on retention.
Features and Benefits:
- Measurable Progress: Easily track retention rates over time to gauge the effectiveness of customer service strategies.
- Segmentation Capabilities: Segment data by customer tenure, value, and acquisition source for targeted improvements.
- ROI Measurement: Quantify the return on investment (ROI) of customer service improvements by linking them to retention rates.
- Predictive Power: High retention rates often correlate with higher customer lifetime value and predictable revenue streams.
- Comparative Analysis: Easier to compare across different business models than churn rate, providing a standardized benchmark.
Pros:
- Positive Framing: Focuses teams on building relationships, not just preventing losses.
- Customer Experience Indicator: Strong indicator of overall customer experience quality.
- Revenue Stability: Directly connects to revenue stability and predictability.
- Quantifiable ROI: Helps quantify the ROI of service investments.
- Cross-Model Comparison: Easier to compare across different business models than churn rate.
Cons:
- Lagging Indicator: Doesn't show immediate service impacts.
- External Influences: Influenced by factors beyond service quality (product value, market competition, etc.).
- Potential for Obscurity: May obscure problems if only measured at an aggregate level.
- Varied Definitions: The definition of an 'active customer' can vary across organizations.
- False Confidence Risk: Can create false confidence if not segmented properly.
Examples of Successful Implementation:
- Amazon Prime: Maintains exceptionally high retention rates above 90% by providing consistent service excellence and continuous value addition.
- Adobe: Increased retention by 7% after transitioning to a customer success model that prioritized proactive support.
- Chewy.com: Achieves industry-leading retention through exceptional service, including personalized touches like handwritten notes and surprise gifts.
Actionable Tips:
- Segment Your Analysis: Segment retention analysis by customer value tiers and tenure cohorts to identify areas for improvement.
- Identify Inflection Points: Determine the point in the customer lifecycle where retention significantly increases.
- Link to Service Interactions: Connect retention data to specific service interactions to identify high-impact touchpoints.
- Implement Win-Back Strategies: Leverage exceptional service in win-back procedures for at-risk customers.
- Create "Moments of Delight": Design "moments of delight" at strategic points in the customer lifecycle to foster loyalty.
- Focus on Renewals: Provide extra service attention to customers approaching renewal decisions.
Learn more about Customer Retention Rate
When and Why to Use This Approach:
Customer Retention Rate is especially important for subscription-based businesses, e-commerce retailers, and any organization focused on building long-term customer relationships. It is a critical KPI for businesses seeking scalable 24/7 support, aiming to improve order management and response times, automating repetitive inquiries, or offering AI-driven support solutions. For global enterprises requiring multilingual, round-the-clock customer engagement, understanding and improving retention is crucial for sustainable growth. Tracking and analyzing customer retention rate provides valuable insights into the effectiveness of customer service efforts and helps justify investments in improving customer experience.
8 Key Customer Service KPIs Comparison
| KPI | 🔄 Implementation Complexity | ⚡ Resource Requirements | 📊 Expected Outcomes | 💡 Ideal Use Cases | ⭐ Key Advantages |
|---|---|---|---|---|---|
| Customer Satisfaction Score (CSAT) | Low - Simple surveys after interactions | Low - Basic survey tools and data collection | Quick feedback on specific experiences | Rapid service interaction assessment | Immediate, actionable feedback; high response rates |
| Net Promoter Score (NPS) | Low - Single question survey | Low to Medium - Survey distribution and analysis | Measures customer loyalty and advocacy | Tracking overall brand loyalty and referrals | Strong business growth correlation; widely benchmarked |
| First Contact Resolution (FCR) | Medium - Requires tracking resolution status | Medium - Reliable tracking systems & agent training | Increased efficiency and customer satisfaction | Contact centers aiming to reduce repeat contacts | Direct link to satisfaction; reduces operational costs |
| Average Resolution Time | Medium - Track end-to-end issue resolution | Medium to High - Requires workflow tracking | Insight into total time to fix issues | Complex support cases needing detailed efficiency | Identifies bottlenecks; customer-centric efficiency metric |
| Customer Effort Score (CES) | Low to Medium - Post-interaction ease surveys | Low - Survey tools focused on effort measurement | Reveals friction points impacting loyalty | Improving customer journey and reducing friction | Strong predictor of loyalty; actionable on pain points |
| Customer Churn Rate | Medium - Requires customer activity tracking | Medium to High - CRM and analytics to track churn | Reflects financial impact of service quality | Businesses focused on retention strategies | Links service quality to financial outcomes; predictive power |
| Average Handle Time (AHT) | Medium - Measure full interaction durations | Medium - Call analytics and agent monitoring | Operational efficiency and staffing insights | Contact centers balancing speed and quality | Direct efficiency indicator; aids capacity planning |
| Customer Retention Rate | Medium - Needs cohort tracking and segmentation | Medium - CRM and analytics for retention monitoring | Highlights long-term relationship success | Subscription and recurring revenue models | Positive focus on retention; correlates with revenue growth |
Transform Your Customer Service with Data-Driven Decisions
This article has explored eight key performance indicators for customer service: Customer Satisfaction Score (CSAT), Net Promoter Score (NPS), First Contact Resolution (FCR), Average Resolution Time, Customer Effort Score (CES), Customer Churn Rate, Average Handle Time (AHT), and Customer Retention Rate. Mastering these key performance indicators for customer service is crucial for understanding where your customer service excels and where it needs improvement. These metrics provide a clear picture of your customer experience, allowing you to identify pain points, optimize processes, and ultimately, boost customer loyalty and drive business growth. From small businesses seeking scalable support solutions to global enterprises managing multilingual interactions, these KPIs offer invaluable insights for any organization prioritizing customer satisfaction.
By consistently monitoring and analyzing these key performance indicators for customer service, you can make data-driven decisions that directly impact your bottom line. This empowers you to not only react to customer service issues but also proactively prevent them, fostering stronger relationships with your customers and building a more sustainable business model. Empower your team to deliver exceptional customer service experiences through data-driven insights. Ready to transform your customer service operations and unlock the full potential of your customer interactions? Explore how FlowGent AI can streamline the measurement and analysis of these crucial KPIs, providing real-time data and actionable intelligence to optimize your customer service performance.